Park Lawn Corporation's (TSE:PLC) Stock is Soaring But Financials Seem Inconsistent: Will The Uptrend Continue?
Park Lawn's (TSE:PLC) stock is up by a considerable 13% over the past three months. But the company's key financial indicators appear to be differing across the board and that makes us question whether or not the company's current share price momentum can be maintained. Specifically, we decided to study Park Lawn's ROE in this article.
Return on equity or ROE is a key measure used to assess how efficiently a company's management is utilizing the company's capital. Simply put, it is used to assess the profitability of a company in relation to its equity capital.
See our latest analysis for Park Lawn
How Do You Calculate Return On Equity?
ROE can be calculated by using the formula:
Return on Equity = Net Profit (from continuing operations) ÷ Shareholders' Equity
So, based on the above formula, the ROE for Park Lawn is:
5.5% = CA$28m ÷ CA$513m (Based on the trailing twelve months to March 2021).
The 'return' refers to a company's earnings over the last year. One way to conceptualize this is that for each CA$1 of shareholders' capital it has, the company made CA$0.06 in profit.
Why Is ROE Important For Earnings Growth?
We have already established that ROE serves as an efficient profit-generating gauge for a company's future earnings. Depending on how much of these profits the company reinvests or "retains", and how effectively it does so, we are then able to assess a company’s earnings growth potential. Assuming all else is equal, companies that have both a higher return on equity and higher profit retention are usually the ones that have a higher growth rate when compared to companies that don't have the same features.
A Side By Side comparison of Park Lawn's Earnings Growth And 5.5% ROE
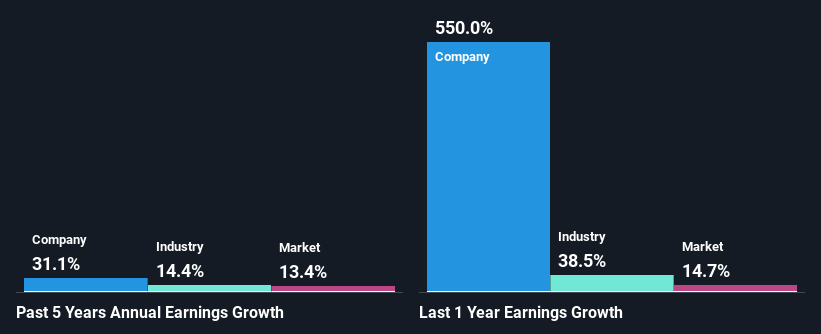
When you first look at it, Park Lawn's ROE doesn't look that attractive. We then compared the company's ROE to the broader industry and were disappointed to see that the ROE is lower than the industry average of 9.3%. In spite of this, Park Lawn was able to grow its net income considerably, at a rate of 31% in the last five years. We reckon that there could be other factors at play here. For instance, the company has a low payout ratio or is being managed efficiently.
Next, on comparing with the industry net income growth, we found that Park Lawn's growth is quite high when compared to the industry average growth of 1.6% in the same period, which is great to see.
Earnings growth is a huge factor in stock valuation. It’s important for an investor to know whether the market has priced in the company's expected earnings growth (or decline). Doing so will help them establish if the stock's future looks promising or ominous. Has the market priced in the future outlook for PLC? You can find out in our latest intrinsic value infographic research report.
Is Park Lawn Efficiently Re-investing Its Profits?
The really high three-year median payout ratio of 140% for Park Lawn suggests that the company is paying its shareholders more than what it is earning. However, this hasn't hampered its ability to grow as we saw earlier. Having said that, the high payout ratio is definitely risky and something to keep an eye on. To know the 2 risks we have identified for Park Lawn visit our risks dashboard for free.
Additionally, Park Lawn has paid dividends over a period of at least ten years which means that the company is pretty serious about sharing its profits with shareholders.
Conclusion
Overall, we have mixed feelings about Park Lawn. While the company has posted impressive earnings growth, its poor ROE and low earnings retention makes us doubtful if that growth could continue, if by any chance the business is faced with any sort of risk. Until now, we have only just grazed the surface of the company's past performance by looking at the company's fundamentals. So it may be worth checking this free detailed graph of Park Lawn's past earnings, as well as revenue and cash flows to get a deeper insight into the company's performance.
This article by Simply Wall St is general in nature. It does not constitute a recommendation to buy or sell any stock, and does not take account of your objectives, or your financial situation. We aim to bring you long-term focused analysis driven by fundamental data. Note that our analysis may not factor in the latest price-sensitive company announcements or qualitative material. Simply Wall St has no position in any stocks mentioned.
Have feedback on this article? Concerned about the content? Get in touch with us directly. Alternatively, email editorial-team (at) simplywallst.com.
