Do You Like PayPoint plc (LON:PAY) At This P/E Ratio?

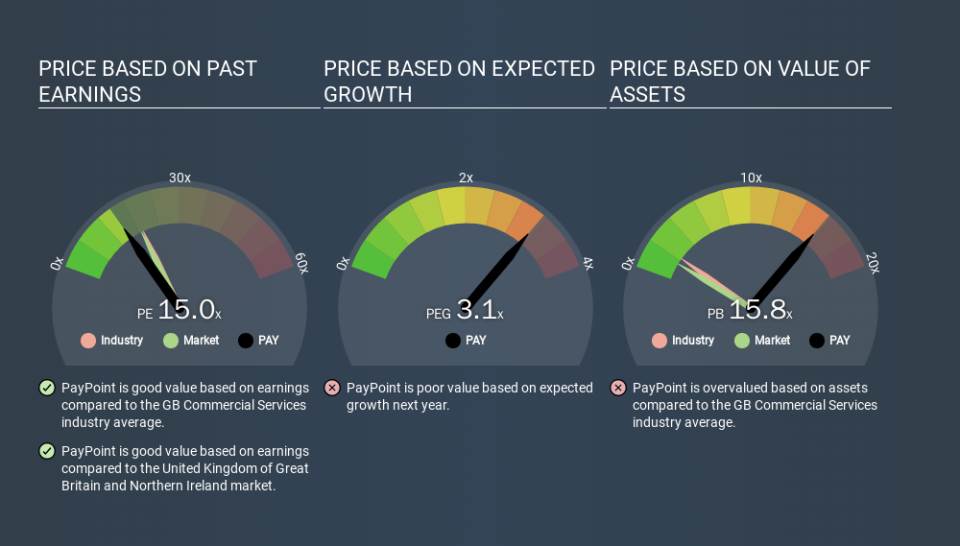
This article is for investors who would like to improve their understanding of price to earnings ratios (P/E ratios). We'll apply a basic P/E ratio analysis to PayPoint plc's (LON:PAY), to help you decide if the stock is worth further research. Looking at earnings over the last twelve months, PayPoint has a P/E ratio of 15.01. That corresponds to an earnings yield of approximately 6.7%.
See our latest analysis for PayPoint
How Do I Calculate A Price To Earnings Ratio?
The formula for price to earnings is:
Price to Earnings Ratio = Share Price ÷ Earnings per Share (EPS)
Or for PayPoint:
P/E of 15.01 = GBP9.56 ÷ GBP0.64 (Based on the year to September 2019.)
Is A High Price-to-Earnings Ratio Good?
A higher P/E ratio means that investors are paying a higher price for each GBP1 of company earnings. That is not a good or a bad thing per se, but a high P/E does imply buyers are optimistic about the future.
How Does PayPoint's P/E Ratio Compare To Its Peers?
One good way to get a quick read on what market participants expect of a company is to look at its P/E ratio. If you look at the image below, you can see PayPoint has a lower P/E than the average (19.5) in the commercial services industry classification.
This suggests that market participants think PayPoint will underperform other companies in its industry. Since the market seems unimpressed with PayPoint, it's quite possible it could surprise on the upside. It is arguably worth checking if insiders are buying shares, because that might imply they believe the stock is undervalued.
How Growth Rates Impact P/E Ratios
Earnings growth rates have a big influence on P/E ratios. If earnings are growing quickly, then the 'E' in the equation will increase faster than it would otherwise. And in that case, the P/E ratio itself will drop rather quickly. And as that P/E ratio drops, the company will look cheap, unless its share price increases.
PayPoint had pretty flat EPS growth in the last year. But it has grown its earnings per share by 3.0% per year over the last five years.
Don't Forget: The P/E Does Not Account For Debt or Bank Deposits
Don't forget that the P/E ratio considers market capitalization. In other words, it does not consider any debt or cash that the company may have on the balance sheet. Theoretically, a business can improve its earnings (and produce a lower P/E in the future) by investing in growth. That means taking on debt (or spending its cash).
Such expenditure might be good or bad, in the long term, but the point here is that the balance sheet is not reflected by this ratio.
How Does PayPoint's Debt Impact Its P/E Ratio?
Since PayPoint holds net cash of UK£23m, it can spend on growth, justifying a higher P/E ratio than otherwise.
The Verdict On PayPoint's P/E Ratio
PayPoint trades on a P/E ratio of 15.0, which is below the GB market average of 18.5. Falling earnings per share are likely to be keeping potential buyers away, the healthy balance sheet means the company retains potential for future growth. If that occurs, the current low P/E could prove to be temporary.
Investors should be looking to buy stocks that the market is wrong about. If the reality for a company is not as bad as the P/E ratio indicates, then the share price should increase as the market realizes this. So this free visual report on analyst forecasts could hold the key to an excellent investment decision.
Of course, you might find a fantastic investment by looking at a few good candidates. So take a peek at this free list of companies with modest (or no) debt, trading on a P/E below 20.
If you spot an error that warrants correction, please contact the editor at editorial-team@simplywallst.com. This article by Simply Wall St is general in nature. It does not constitute a recommendation to buy or sell any stock, and does not take account of your objectives, or your financial situation. Simply Wall St has no position in the stocks mentioned.
We aim to bring you long-term focused research analysis driven by fundamental data. Note that our analysis may not factor in the latest price-sensitive company announcements or qualitative material. Thank you for reading.
