What Percentage Of NewOcean Energy Holdings Limited (HKG:342) Shares Do Insiders Own?

The big shareholder groups in NewOcean Energy Holdings Limited (HKG:342) have power over the company. Insiders often own a large chunk of younger, smaller, companies while huge companies tend to have institutions as shareholders. I generally like to see some degree of insider ownership, even if only a little. As Nassim Nicholas Taleb said, 'Don’t tell me what you think, tell me what you have in your portfolio.
With a market capitalization of HK$2.1b, NewOcean Energy Holdings is a small cap stock, so it might not be well known by many institutional investors. Taking a look at our data on the ownership groups (below), it's seems that institutions are noticeable on the share registry. We can zoom in on the different ownership groups, to learn more about 342.
View our latest analysis for NewOcean Energy Holdings

What Does The Institutional Ownership Tell Us About NewOcean Energy Holdings?
Institutional investors commonly compare their own returns to the returns of a commonly followed index. So they generally do consider buying larger companies that are included in the relevant benchmark index.
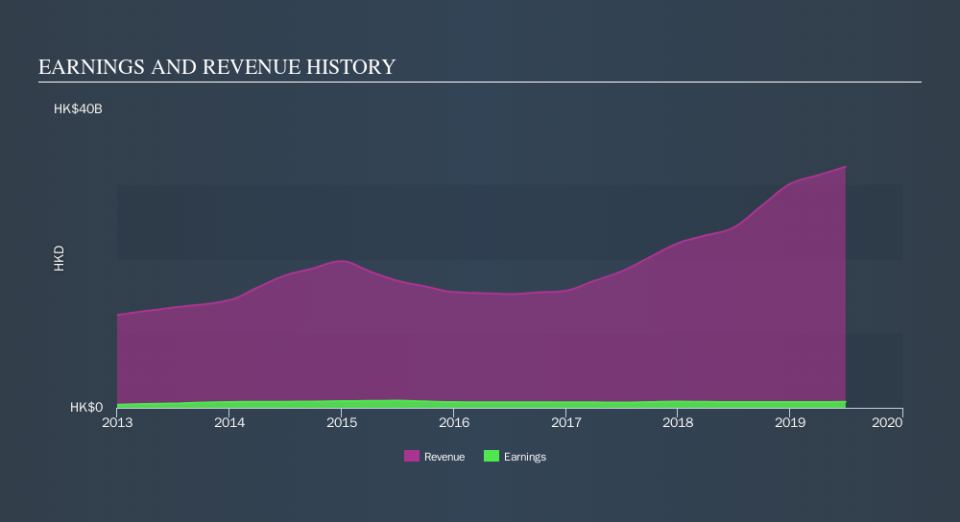
NewOcean Energy Holdings already has institutions on the share registry. Indeed, they own 14% of the company. This suggests some credibility amongst professional investors. But we can't rely on that fact alone, since institutions make bad investments sometimes, just like everyone does. If multiple institutions change their view on a stock at the same time, you could see the share price drop fast. It's therefore worth looking at NewOcean Energy Holdings's earnings history, below. Of course, the future is what really matters.
We note that hedge funds don't have a meaningful investment in NewOcean Energy Holdings. Our information suggests that there isn't any analyst coverage of the stock, so it is probably little known.
Insider Ownership Of NewOcean Energy Holdings
The definition of an insider can differ slightly between different countries, but members of the board of directors always count. Company management run the business, but the CEO will answer to the board, even if he or she is a member of it.
Most consider insider ownership a positive because it can indicate the board is well aligned with other shareholders. However, on some occasions too much power is concentrated within this group.
Our most recent data indicates that insiders own a reasonable proportion of NewOcean Energy Holdings Limited. It has a market capitalization of just HK$2.1b, and insiders have HK$209m worth of shares in their own names. This may suggest that the founders still own a lot of shares. You can click here to see if they have been buying or selling.
General Public Ownership
The general public holds a 36% stake in 342. While this group can't necessarily call the shots, it can certainly have a real influence on how the company is run.
Private Equity Ownership
With a stake of 5.7%, private equity firms could influence the 342 board. Sometimes we see private equity stick around for the long term, but generally speaking they have a shorter investment horizon and -- as the name suggests -- don't invest in public companies much. After some time they may look to sell and redeploy capital elsewhere.
Private Company Ownership
Our data indicates that Private Companies hold 33%, of the company's shares. Private companies may be related parties. Sometimes insiders have an interest in a public company through a holding in a private company, rather than in their own capacity as an individual. While it's hard to draw any broad stroke conclusions, it is worth noting as an area for further research.
Next Steps:
I find it very interesting to look at who exactly owns a company. But to truly gain insight, we need to consider other information, too.
I like to dive deeper into how a company has performed in the past. You can access this interactive graph of past earnings, revenue and cash flow for free.
If you would prefer check out another company -- one with potentially superior financials -- then do not miss this free list of interesting companies, backed by strong financial data.
NB: Figures in this article are calculated using data from the last twelve months, which refer to the 12-month period ending on the last date of the month the financial statement is dated. This may not be consistent with full year annual report figures.
We aim to bring you long-term focused research analysis driven by fundamental data. Note that our analysis may not factor in the latest price-sensitive company announcements or qualitative material.
If you spot an error that warrants correction, please contact the editor at editorial-team@simplywallst.com. This article by Simply Wall St is general in nature. It does not constitute a recommendation to buy or sell any stock, and does not take account of your objectives, or your financial situation. Simply Wall St has no position in the stocks mentioned. Thank you for reading.

