What Is Perennial International's (HKG:725) P/E Ratio After Its Share Price Tanked?

Unfortunately for some shareholders, the Perennial International (HKG:725) share price has dived 31% in the last thirty days. That drop has capped off a tough year for shareholders, with the share price down 47% in that time.
Assuming nothing else has changed, a lower share price makes a stock more attractive to potential buyers. While the market sentiment towards a stock is very changeable, in the long run, the share price will tend to move in the same direction as earnings per share. The implication here is that long term investors have an opportunity when expectations of a company are too low. One way to gauge market expectations of a stock is to look at its Price to Earnings Ratio (PE Ratio). A high P/E implies that investors have high expectations of what a company can achieve compared to a company with a low P/E ratio.
Check out our latest analysis for Perennial International
How Does Perennial International's P/E Ratio Compare To Its Peers?
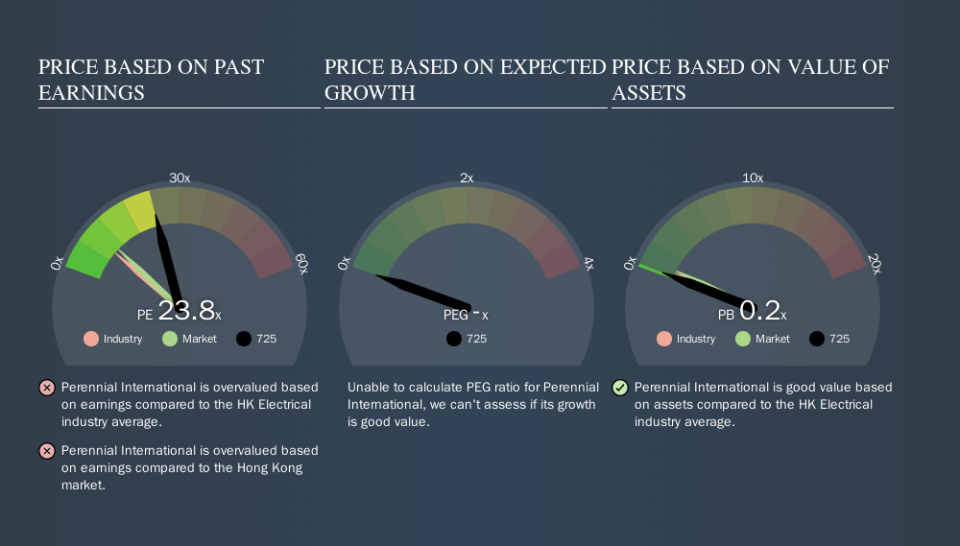
Perennial International's P/E of 23.82 indicates some degree of optimism towards the stock. As you can see below, Perennial International has a higher P/E than the average company (8.8) in the electrical industry.
That means that the market expects Perennial International will outperform other companies in its industry. Shareholders are clearly optimistic, but the future is always uncertain. So investors should delve deeper. I like to check if company insiders have been buying or selling.
How Growth Rates Impact P/E Ratios
When earnings fall, the 'E' decreases, over time. Therefore, even if you pay a low multiple of earnings now, that multiple will become higher in the future. Then, a higher P/E might scare off shareholders, pushing the share price down.
Perennial International's earnings per share fell by 41% in the last twelve months. And it has shrunk its earnings per share by 26% per year over the last five years. This might lead to muted expectations.
A Limitation: P/E Ratios Ignore Debt and Cash In The Bank
Don't forget that the P/E ratio considers market capitalization. Thus, the metric does not reflect cash or debt held by the company. In theory, a company can lower its future P/E ratio by using cash or debt to invest in growth.
Spending on growth might be good or bad a few years later, but the point is that the P/E ratio does not account for the option (or lack thereof).
Is Debt Impacting Perennial International's P/E?
Net debt totals 16% of Perennial International's market cap. This could bring some additional risk, and reduce the number of investment options for management; worth remembering if you compare its P/E to businesses without debt.
The Bottom Line On Perennial International's P/E Ratio
Perennial International has a P/E of 23.8. That's higher than the average in its market, which is 10.2. With some debt but no EPS growth last year, the market has high expectations of future profits. What can be absolutely certain is that the market has become significantly less optimistic about Perennial International over the last month, with the P/E ratio falling from 34.6 back then to 23.8 today. For those who prefer to invest with the flow of momentum, that might be a bad sign, but for a contrarian, it may signal opportunity.
Investors have an opportunity when market expectations about a stock are wrong. As value investor Benjamin Graham famously said, 'In the short run, the market is a voting machine but in the long run, it is a weighing machine. We don't have analyst forecasts, but shareholders might want to examine this detailed historical graph of earnings, revenue and cash flow.
You might be able to find a better buy than Perennial International. If you want a selection of possible winners, check out this free list of interesting companies that trade on a P/E below 20 (but have proven they can grow earnings).
We aim to bring you long-term focused research analysis driven by fundamental data. Note that our analysis may not factor in the latest price-sensitive company announcements or qualitative material.
If you spot an error that warrants correction, please contact the editor at editorial-team@simplywallst.com. This article by Simply Wall St is general in nature. It does not constitute a recommendation to buy or sell any stock, and does not take account of your objectives, or your financial situation. Simply Wall St has no position in the stocks mentioned. Thank you for reading.
