Can Performance Technologies S.A. (ATH:PERF) Maintain Its Strong Returns?

One of the best investments we can make is in our own knowledge and skill set. With that in mind, this article will work through how we can use Return On Equity (ROE) to better understand a business. By way of learning-by-doing, we'll look at ROE to gain a better understanding of Performance Technologies S.A. (ATH:PERF).
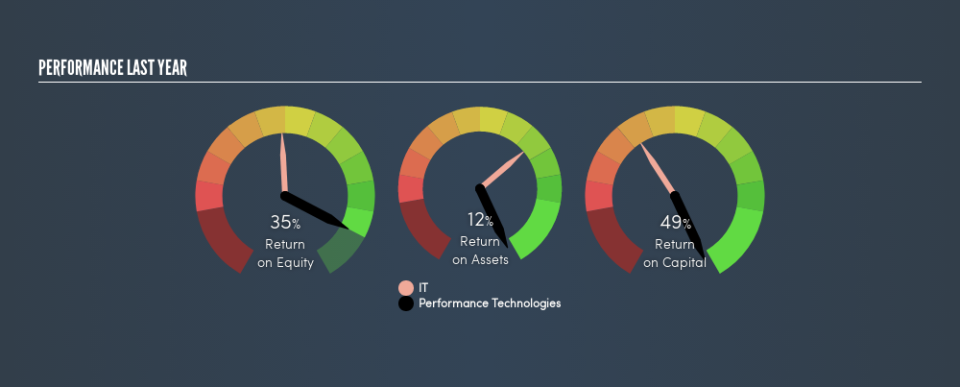
Our data shows Performance Technologies has a return on equity of 35% for the last year. That means that for every €1 worth of shareholders' equity, it generated €0.35 in profit.
Want to participate in a short research study? Help shape the future of investing tools and you could win a $250 gift card!
Check out our latest analysis for Performance Technologies
How Do You Calculate Return On Equity?
The formula for ROE is:
Return on Equity = Net Profit ÷ Shareholders' Equity
Or for Performance Technologies:
35% = €1.4m ÷ €4.1m (Based on the trailing twelve months to December 2018.)
It's easy to understand the 'net profit' part of that equation, but 'shareholders' equity' requires further explanation. It is the capital paid in by shareholders, plus any retained earnings. Shareholders' equity can be calculated by subtracting the total liabilities of the company from the total assets of the company.
What Does Return On Equity Signify?
Return on Equity measures a company's profitability against the profit it has kept for the business (plus any capital injections). The 'return' is the amount earned after tax over the last twelve months. A higher profit will lead to a higher ROE. So, all else being equal, a high ROE is better than a low one. That means it can be interesting to compare the ROE of different companies.
Does Performance Technologies Have A Good Return On Equity?
Arguably the easiest way to assess company's ROE is to compare it with the average in its industry. The limitation of this approach is that some companies are quite different from others, even within the same industry classification. As is clear from the image below, Performance Technologies has a better ROE than the average (15%) in the IT industry.
That is a good sign. In my book, a high ROE almost always warrants a closer look. One data point to check is if insiders have bought shares recently.
The Importance Of Debt To Return On Equity
Companies usually need to invest money to grow their profits. That cash can come from issuing shares, retained earnings, or debt. In the first two cases, the ROE will capture this use of capital to grow. In the latter case, the debt required for growth will boost returns, but will not impact the shareholders' equity. That will make the ROE look better than if no debt was used.
Performance Technologies's Debt And Its 35% ROE
Performance Technologies has a debt to equity ratio of 0.65, which is far from excessive. The combination of modest debt and a very impressive ROE does suggest that the business is high quality. Careful use of debt to boost returns is often very good for shareholders. However, it could reduce the company's ability to take advantage of future opportunities.
In Summary
Return on equity is useful for comparing the quality of different businesses. Companies that can achieve high returns on equity without too much debt are generally of good quality. If two companies have the same ROE, then I would generally prefer the one with less debt.
Having said that, while ROE is a useful indicator of business quality, you'll have to look at a whole range of factors to determine the right price to buy a stock. It is important to consider other factors, such as future profit growth -- and how much investment is required going forward. So I think it may be worth checking this free this detailed graph of past earnings, revenue and cash flow .
But note: Performance Technologies may not be the best stock to buy. So take a peek at this free list of interesting companies with high ROE and low debt.
We aim to bring you long-term focused research analysis driven by fundamental data. Note that our analysis may not factor in the latest price-sensitive company announcements or qualitative material.
If you spot an error that warrants correction, please contact the editor at editorial-team@simplywallst.com. This article by Simply Wall St is general in nature. It does not constitute a recommendation to buy or sell any stock, and does not take account of your objectives, or your financial situation. Simply Wall St has no position in the stocks mentioned. Thank you for reading.

