The Pharmagest Interactive (EPA:PHA) Share Price Has Gained 183%, So Why Not Pay It Some Attention?

The worst result, after buying shares in a company (assuming no leverage), would be if you lose all the money you put in. But on a lighter note, a good company can see its share price rise well over 100%. One great example is Pharmagest Interactive SA (EPA:PHA) which saw its share price drive 183% higher over five years. Also pleasing for shareholders was the 11% gain in the last three months. But this could be related to the strong market, which is up 14% in the last three months.
Check out our latest analysis for Pharmagest Interactive
In his essay The Superinvestors of Graham-and-Doddsville Warren Buffett described how share prices do not always rationally reflect the value of a business. By comparing earnings per share (EPS) and share price changes over time, we can get a feel for how investor attitudes to a company have morphed over time.
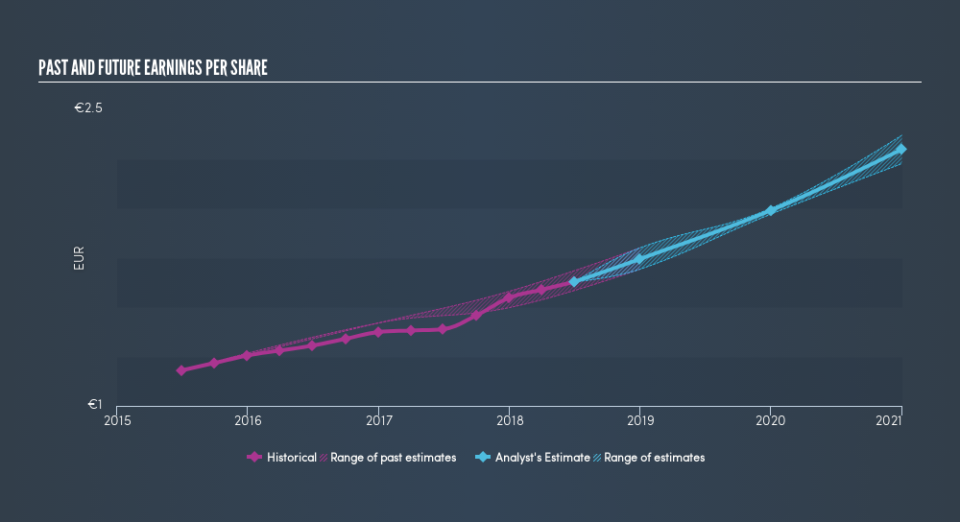
During five years of share price growth, Pharmagest Interactive achieved compound earnings per share (EPS) growth of 11% per year. This EPS growth is slower than the share price growth of 23% per year, over the same period. So it’s fair to assume the market has a higher opinion of the business than it did five years ago. And that’s hardly shocking given the track record of growth.
You can see how EPS has changed over time in the image below (click on the chart to see the exact values).
We’re pleased to report that the CEO is remunerated more modestly than most CEOs at similarly capitalized companies. But while CEO remuneration is always worth checking, the really important question is whether the company can grow earnings going forward. Dive deeper into the earnings by checking this interactive graph of Pharmagest Interactive’s earnings, revenue and cash flow.
What About Dividends?
As well as measuring the share price return, investors should also consider the total shareholder return (TSR). The TSR is a return calculation that accounts for the value of cash dividends (assuming that any dividend received was reinvested) and the calculated value of any discounted capital raisings. It’s fair to say that the TSR gives a more complete picture for stocks that pay a dividend. We note that for Pharmagest Interactive the TSR over the last 5 years was 215%, which is better than the share price return mentioned above. The dividends paid by the company have thusly boosted the total shareholder return.
A Different Perspective
Pharmagest Interactive shareholders gained a total return of 4.4% during the year. But that was short of the market average. It’s probably a good sign that the company has an even better long term track record, having provided shareholders with an annual TSR of 26% over five years. Maybe the share price is just taking a breather while the business executes on its growth strategy. Is Pharmagest Interactive cheap compared to other companies? These 3 valuation measures might help you decide.
If you would prefer to check out another company — one with potentially superior financials — then do not miss this free list of companies that have proven they can grow earnings.
Please note, the market returns quoted in this article reflect the market weighted average returns of stocks that currently trade on FR exchanges.
We aim to bring you long-term focused research analysis driven by fundamental data. Note that our analysis may not factor in the latest price-sensitive company announcements or qualitative material.
If you spot an error that warrants correction, please contact the editor at editorial-team@simplywallst.com. This article by Simply Wall St is general in nature. It does not constitute a recommendation to buy or sell any stock, and does not take account of your objectives, or your financial situation. Simply Wall St has no position in the stocks mentioned. Thank you for reading.

