Is Pharmanutra S.p.A.’s (BIT:PHN) Balance Sheet A Threat To Its Future?

Want to participate in a short research study? Help shape the future of investing tools and receive a $20 prize!
While small-cap stocks, such as Pharmanutra S.p.A. (BIT:PHN) with its market cap of €163m, are popular for their explosive growth, investors should also be aware of their balance sheet to judge whether the company can survive a downturn. Assessing first and foremost the financial health is essential, since poor capital management may bring about bankruptcies, which occur at a higher rate for small-caps. Here are a few basic checks that are good enough to have a broad overview of the company’s financial strength. However, this commentary is still very high-level, so I recommend you dig deeper yourself into PHN here.
How does PHN’s operating cash flow stack up against its debt?
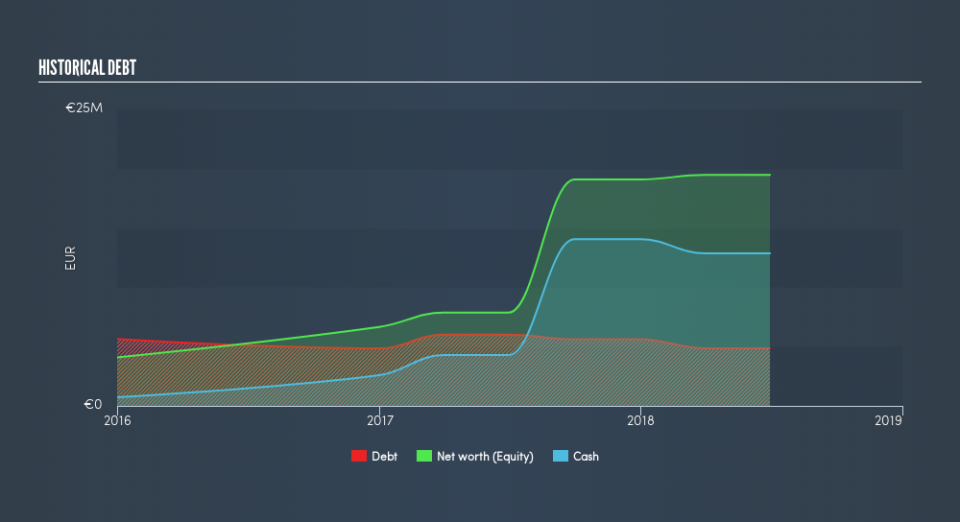
PHN’s debt levels have fallen from €6.0m to €4.9m over the last 12 months , which includes long-term debt. With this debt payback, PHN’s cash and short-term investments stands at €13m for investing into the business. Moreover, PHN has generated €6.0m in operating cash flow during the same period of time, resulting in an operating cash to total debt ratio of 123%, meaning that PHN’s current level of operating cash is high enough to cover debt. This ratio can also be interpreted as a measure of efficiency as an alternative to return on assets. In PHN’s case, it is able to generate 1.23x cash from its debt capital.
Does PHN’s liquid assets cover its short-term commitments?
At the current liabilities level of €12m, it seems that the business has been able to meet these obligations given the level of current assets of €29m, with a current ratio of 2.38x. Generally, for Personal Products companies, this is a reasonable ratio as there’s enough of a cash buffer without holding too much capital in low return investments.
Can PHN service its debt comfortably?
With debt at 25% of equity, PHN may be thought of as appropriately levered. PHN is not taking on too much debt commitment, which can be restrictive and risky for equity-holders. We can check to see whether PHN is able to meet its debt obligations by looking at the net interest coverage ratio. A company generating earnings before interest and tax (EBIT) at least three times its net interest payments is considered financially sound. In PHN’s, case, the ratio of 147x suggests that interest is comfortably covered, which means that lenders may be less hesitant to lend out more funding as PHN’s high interest coverage is seen as responsible and safe practice.
Next Steps:
PHN’s high cash coverage and appropriate debt levels indicate its ability to utilise its borrowings efficiently in order to generate ample cash flow. Furthermore, the company exhibits an ability to meet its near term obligations should an adverse event occur. I admit this is a fairly basic analysis for PHN’s financial health. Other important fundamentals need to be considered alongside. I recommend you continue to research Pharmanutra to get a more holistic view of the stock by looking at:
Future Outlook: What are well-informed industry analysts predicting for PHN’s future growth? Take a look at our free research report of analyst consensus for PHN’s outlook.
Valuation: What is PHN worth today? Is the stock undervalued, even when its growth outlook is factored into its intrinsic value? The intrinsic value infographic in our free research report helps visualize whether PHN is currently mispriced by the market.
Other High-Performing Stocks: Are there other stocks that provide better prospects with proven track records? Explore our free list of these great stocks here.
We aim to bring you long-term focused research analysis driven by fundamental data. Note that our analysis may not factor in the latest price-sensitive company announcements or qualitative material.
If you spot an error that warrants correction, please contact the editor at editorial-team@simplywallst.com. This article by Simply Wall St is general in nature. It does not constitute a recommendation to buy or sell any stock, and does not take account of your objectives, or your financial situation. Simply Wall St has no position in the stocks mentioned. Thank you for reading.

