Is Phileo Australia Limited’s (ASX:PHI) ROE Of 41% Impressive?

Many investors are still learning about the various metrics that can be useful when analysing a stock. This article is for those who would like to learn about Return On Equity (ROE). We’ll use ROE to examine Phileo Australia Limited (ASX:PHI), by way of a worked example.
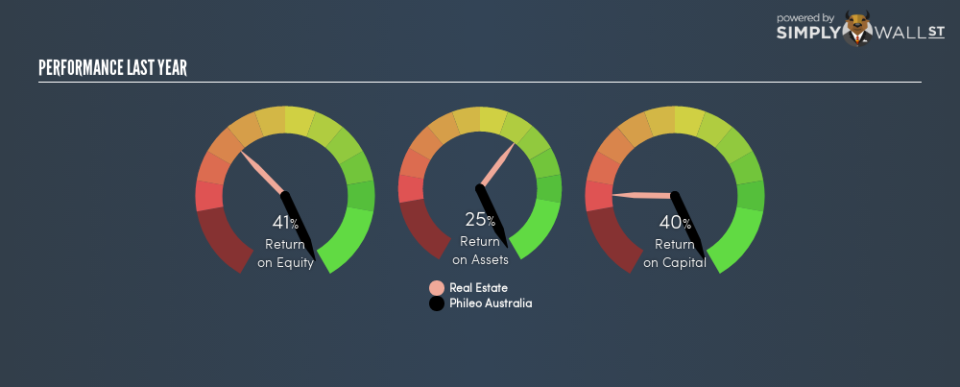
Over the last twelve months Phileo Australia has recorded a ROE of 41%. One way to conceptualize this, is that for each A$1 of shareholders’ equity it has, the company made A$0.41 in profit.
See our latest analysis for Phileo Australia
Want to help shape the future of investing tools and platforms? Take the survey and be part of one of the most advanced studies of stock market investors to date.
How Do You Calculate Return On Equity?
The formula for ROE is:
Return on Equity = Net Profit ÷ Shareholders’ Equity
Or for Phileo Australia:
41% = 85.098532 ÷ AU$208m (Based on the trailing twelve months to June 2018.)
It’s easy to understand the ‘net profit’ part of that equation, but ‘shareholders’ equity’ requires further explanation. It is all the money paid into the company from shareholders, plus any earnings retained. You can calculate shareholders’ equity by subtracting the company’s total liabilities from its total assets.
What Does Return On Equity Signify?
Return on Equity measures a company’s profitability against the profit it has kept for the business (plus any capital injections). The ‘return’ is the amount earned after tax over the last twelve months. A higher profit will lead to a higher ROE. So, all else equal, investors should like a high ROE. That means ROE can be used to compare two businesses.
Does Phileo Australia Have A Good ROE?
Arguably the easiest way to assess company’s ROE is to compare it with the average in its industry. Importantly, this is far from a perfect measure, because companies differ significantly within the same industry classification. Pleasingly, Phileo Australia has a superior ROE than the average (8.9%) company in the Real Estate industry.
That is a good sign. We think a high ROE, alone, is usually enough to justify further research into a company. One data point to check is if insiders have bought shares recently.
How Does Debt Impact ROE?
Companies usually need to invest money to grow their profits. The cash for investment can come from prior year profits (retained earnings), issuing new shares, or borrowing. In the case of the first and second options, the ROE will reflect this use of cash, for growth. In the latter case, the debt used for growth will improve returns, but won’t affect the total equity. In this manner the use of debt will boost ROE, even though the core economics of the business stay the same.
Combining Phileo Australia’s Debt And Its 41% Return On Equity
Although Phileo Australia does use debt, its debt to equity ratio of 0.23 is still low. Its ROE is very impressive, and given only modest debt, this suggests the business is high quality. Careful use of debt to boost returns is often very good for shareholders. However, it could reduce the company’s ability to take advantage of future opportunities.
The Key Takeaway
Return on equity is a useful indicator of the ability of a business to generate profits and return them to shareholders. A company that can achieve a high return on equity without debt could be considered a high quality business. All else being equal, a higher ROE is better.
But when a business is high quality, the market often bids it up to a price that reflects this. The rate at which profits are likely to grow, relative to the expectations of profit growth reflected in the current price, must be considered, too. Check the past profit growth by Phileo Australia by looking at this visualization of past earnings, revenue and cash flow.
Of course Phileo Australia may not be the best stock to buy. So you may wish to see this free collection of other companies that have high ROE and low debt.
To help readers see past the short term volatility of the financial market, we aim to bring you a long-term focused research analysis purely driven by fundamental data. Note that our analysis does not factor in the latest price-sensitive company announcements.
The author is an independent contributor and at the time of publication had no position in the stocks mentioned. For errors that warrant correction please contact the editor at editorial-team@simplywallst.com.

