Is Phillips Carbon Black Limited’s (NSE:PHILIPCARB) 23% ROCE Any Good?

Today we'll look at Phillips Carbon Black Limited (NSE:PHILIPCARB) and reflect on its potential as an investment. To be precise, we'll consider its Return On Capital Employed (ROCE), as that will inform our view of the quality of the business.
First up, we'll look at what ROCE is and how we calculate it. Second, we'll look at its ROCE compared to similar companies. And finally, we'll look at how its current liabilities are impacting its ROCE.
What is Return On Capital Employed (ROCE)?
ROCE measures the amount of pre-tax profits a company can generate from the capital employed in its business. Generally speaking a higher ROCE is better. Overall, it is a valuable metric that has its flaws. Author Edwin Whiting says to be careful when comparing the ROCE of different businesses, since 'No two businesses are exactly alike.'
So, How Do We Calculate ROCE?
Analysts use this formula to calculate return on capital employed:
Return on Capital Employed = Earnings Before Interest and Tax (EBIT) ÷ (Total Assets - Current Liabilities)
Or for Phillips Carbon Black:
0.23 = ₹4.9b ÷ (₹34b - ₹12b) (Based on the trailing twelve months to June 2019.)
Therefore, Phillips Carbon Black has an ROCE of 23%.
See our latest analysis for Phillips Carbon Black
Is Phillips Carbon Black's ROCE Good?
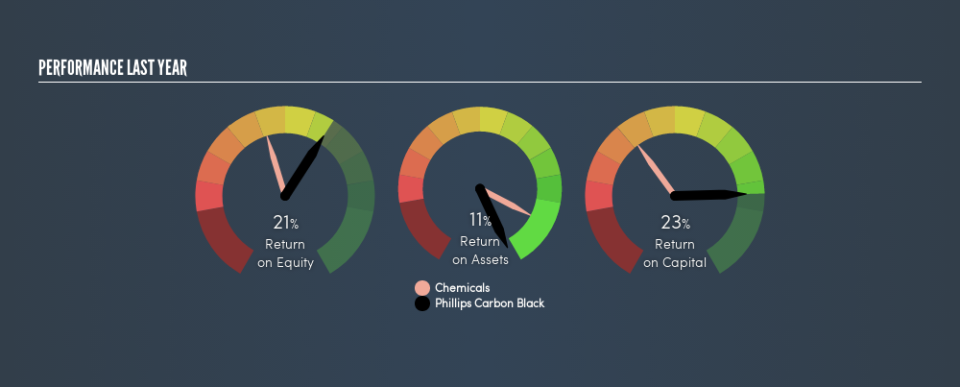
ROCE is commonly used for comparing the performance of similar businesses. Phillips Carbon Black's ROCE appears to be substantially greater than the 17% average in the Chemicals industry. I think that's good to see, since it implies the company is better than other companies at making the most of its capital. Separate from Phillips Carbon Black's performance relative to its industry, its ROCE in absolute terms looks satisfactory, and it may be worth researching in more depth.
We can see that , Phillips Carbon Black currently has an ROCE of 23% compared to its ROCE 3 years ago, which was 7.7%. This makes us think about whether the company has been reinvesting shrewdly. You can click on the image below to see (in greater detail) how Phillips Carbon Black's past growth compares to other companies.
When considering ROCE, bear in mind that it reflects the past and does not necessarily predict the future. Companies in cyclical industries can be difficult to understand using ROCE, as returns typically look high during boom times, and low during busts. This is because ROCE only looks at one year, instead of considering returns across a whole cycle. Future performance is what matters, and you can see analyst predictions in our free report on analyst forecasts for the company.
Do Phillips Carbon Black's Current Liabilities Skew Its ROCE?
Current liabilities include invoices, such as supplier payments, short-term debt, or a tax bill, that need to be paid within 12 months. The ROCE equation subtracts current liabilities from capital employed, so a company with a lot of current liabilities appears to have less capital employed, and a higher ROCE than otherwise. To counter this, investors can check if a company has high current liabilities relative to total assets.
Phillips Carbon Black has total assets of ₹34b and current liabilities of ₹12b. Therefore its current liabilities are equivalent to approximately 36% of its total assets. With this level of current liabilities, Phillips Carbon Black's ROCE is boosted somewhat.
Our Take On Phillips Carbon Black's ROCE
With a decent ROCE, the company could be interesting, but remember that the level of current liabilities make the ROCE look better. Phillips Carbon Black shapes up well under this analysis, but it is far from the only business delivering excellent numbers . You might also want to check this free collection of companies delivering excellent earnings growth.
If you are like me, then you will not want to miss this free list of growing companies that insiders are buying.
We aim to bring you long-term focused research analysis driven by fundamental data. Note that our analysis may not factor in the latest price-sensitive company announcements or qualitative material.
If you spot an error that warrants correction, please contact the editor at editorial-team@simplywallst.com. This article by Simply Wall St is general in nature. It does not constitute a recommendation to buy or sell any stock, and does not take account of your objectives, or your financial situation. Simply Wall St has no position in the stocks mentioned. Thank you for reading.
