New plant hardiness zone map to help NC gardeners, farmers keep pace with climate change
Last month, there was big news in the plant world, and while it shows the weather has been warming in recent years in Southeastern North Carolina, you might just want to wait a few decades before planting your outdoor pineapple and banana trees.
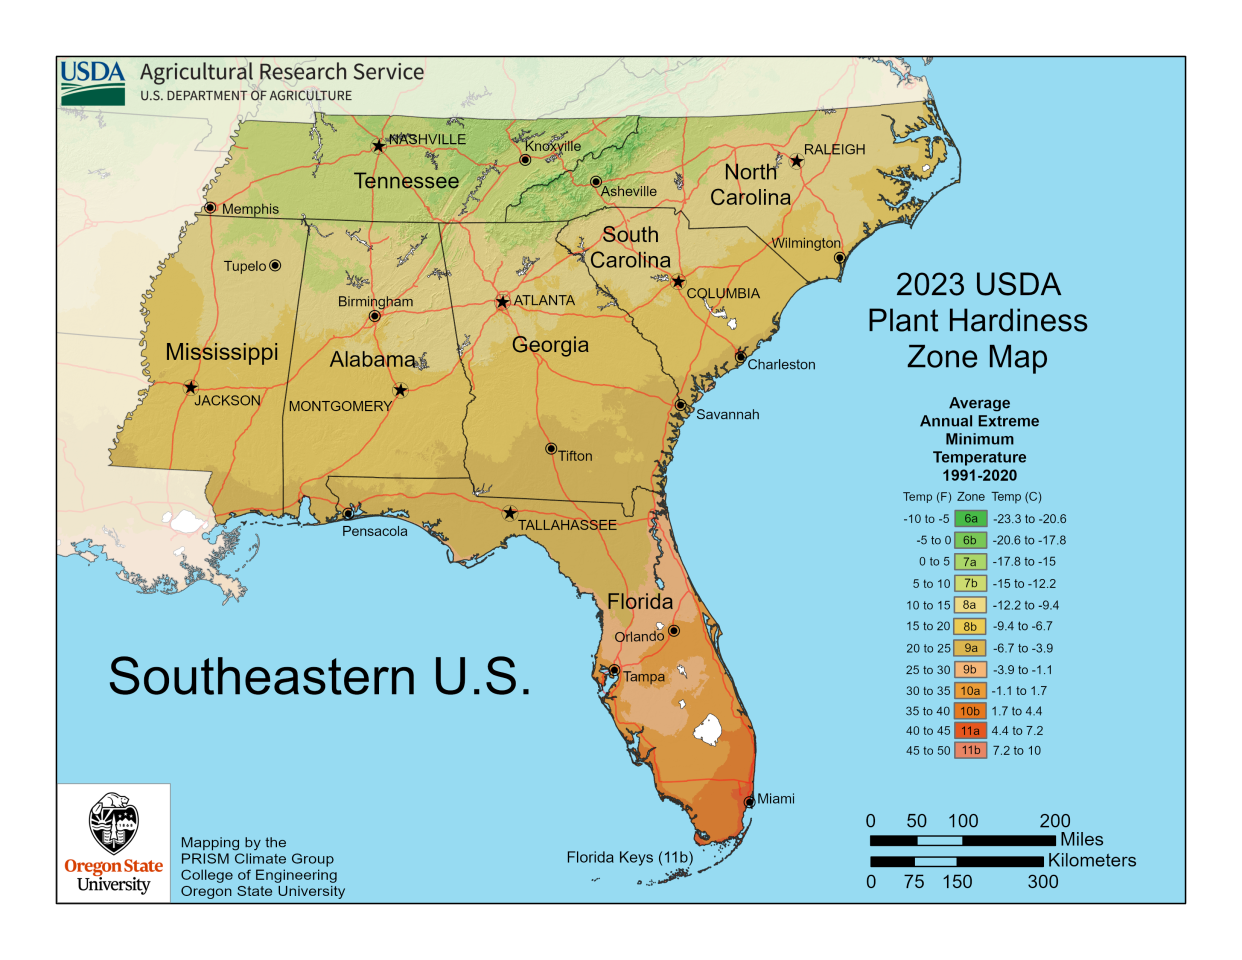
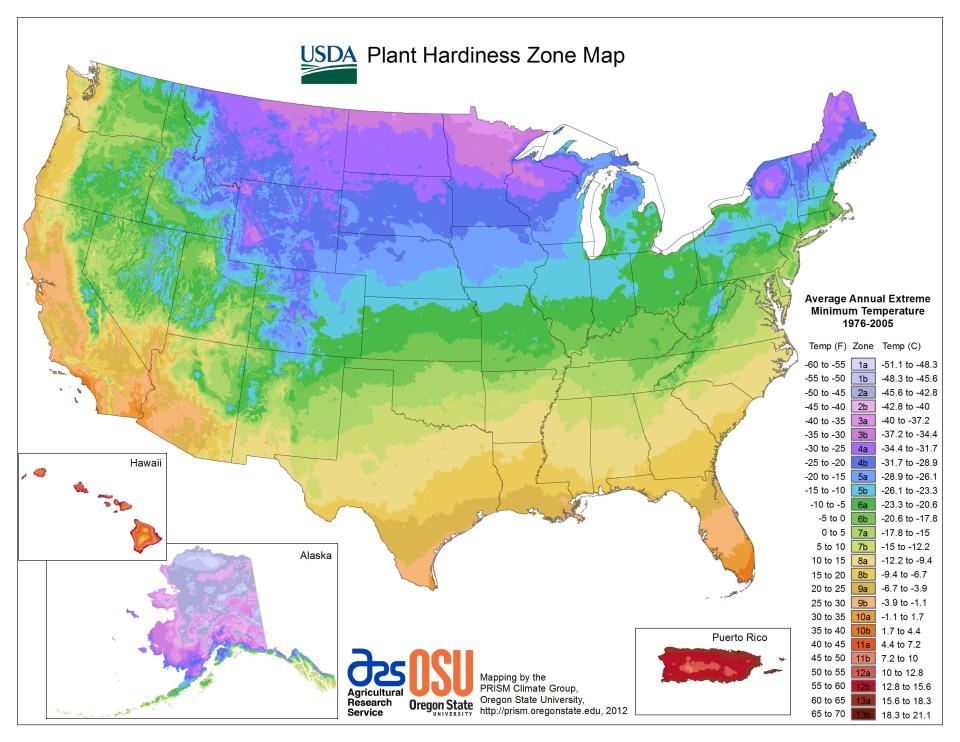
If you have ever tested your green thumb, you've probably taken at least a quick look at the U.S. Department of Agriculture's USDA plant hardiness zone map.
The color-coded map, which covers the entire country, is based on the average annual extreme minimum temperature recorded in a region. It doesn't signify the coldest an area, say Pender County, has ever gotten, but rather the average lowest winter temperatures over a 30-year period.
The zone categories are useful for both homeowners and farmers to know generally how to make the best plant and crop selections for gardens, nurseries and fields, since low temperatures during the winter are crucial factors in the survival of plants at specific locations.
Last month, the USDA released a new hardiness map, which is updated every decade. Along with offering more bells and whistles that allow folks to just type in an address to see their new zone designation, it also uses data from more than 13,600 weather stations for greater accuracy. That compares to the fewer than 8,000 stations used for the 2012 map, according to the USDA.
The new 2023 map also is divided into 10-degree Fahrenheit zones and further divided into 5-degree Fahrenheit half-zones, to reflect microclimates and the inclusion of more weather data. When compared to the 2012 map, the 2023 version reveals that about half of the country shifted to the next warmer half zone, and the other half of the country remained in the same half zone.
"These national differences in zonal boundaries are mostly a result of incorporating temperature data from a more recent time period," according to a USDA release.
WARMING TREND Dreaming of a white Christmas? Then Wilmington might not be your place for the holidays
What does it mean for Southeastern N.C.?
Most of the Wilmington area has now moved from being classified as Zone 8a to now falling into Zone 8b, which shows the average low temperatures run from 15-20 degrees. Parts of inland Pender County are still in Zone 8a, which shows winter lows can dip to 10-15 degrees.
The change in hardiness zones means that plants that were once on the fringes of growing in our area could perhaps perform better or worse due to shifting weather patterns and climate. Certain crops and other vegetables also might now be able to be planted earlier, since the spring warm-up will come sooner on the calendar.
But do the new zone designations also reflect climate change?
Federal officials said while climate change likely played a role in the warming trend, other factors also are reflected in the new zone designations.
"Temperature updates to plant hardiness zones are not necessarily reflective of global climate change because of the highly variable nature of the extreme minimum temperature of the year, as well as the use of increasingly sophisticated mapping methods and the inclusion of data from more weather stations," states the USDA release. "Consequently, map developers involved in the project cautioned against attributing temperature updates made to some zones as reliable and accurate indicators of global climate change (which is usually based on trends in overall average temperatures recorded over long time periods)."
Along with the USDA, the new hardiness maps were developed with help from Oregon State University's PRISM Climate Group.
BIGGER AND BADDER A warming planet is pushing hurricanes north and deeper inland. What that means for NC
Still, there's plenty of evidence to show man's pumping of greenhouse gasses into the atmosphere is helping to accelerate any natural warming that's taking place. The European Union's Copernicus Climate Change Service announced that the world saw its warmest-ever November last month, roughly 1.75 degrees Celsius (3.15 degrees Fahrenheit) warmer than the pre-industrial average. For January to November 2023, the service said global average temperatures were the highest on record − 1.46 degrees Celsius above the pre-industrial average. That means 2023 will be the hottest year ever recorded. Climatologists have said global temperatures this century need to stay under 1.5 degrees Celsius (2.7 degrees Fahrenheit) warmer than pre-industrial levels to prevent irreversible damage to the world's environment.
In North Carolina, most of the hottest years on record have been recorded in the past decade, with 2019 North Carolina’s warmest year in 125 years of record keeping.
Reporter Gareth McGrath can be reached at GMcGrath@Gannett.com or @GarethMcGrathSN on Twitter. This story was produced with financial support from 1Earth Fund and the Prentice Foundation. The USA TODAY Network maintains full editorial control of the work.
This article originally appeared on Wilmington StarNews: New hardiness map to help NC gardeners keep pace with climate change

