How to Play a Growth/Value Ratio Reversal
There seemed to be a significant change in the market on Monday, as investors bailed on the growth and momentum names which had outperformed for some time, and flooded into more stable value stocks. Specifically, the S&P 500 Growth Index fell 0.7% on Monday, while the Value Index gained 0.8%. As a CNBC article highlighting Monday’s rotation into value names explained, "This shift is unnerving to investors because... [a] rotation away from these stocks could result in a downturn for the broader market."
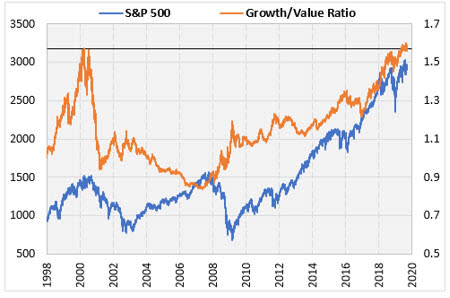
The chart below shows the ratio of the S&P 500 Growth Index to the S&P 500 Value Index. This ratio recently surpassed its highest level ever, which occurred at the peak of the tech boom. The analysis below delves into what this ratio has meant in the past.
The S&P Growth/Value Ratio and the Stock Market
The growth/value ratio has been rising throughout the stock market rally since 2009. This has caused some alarm among investors, who seem to think if the ratio reverses, then the market might reverse too. Eyeballing the chart above, I see the ratio decreasing through most of the rally from 2002 through 2007.
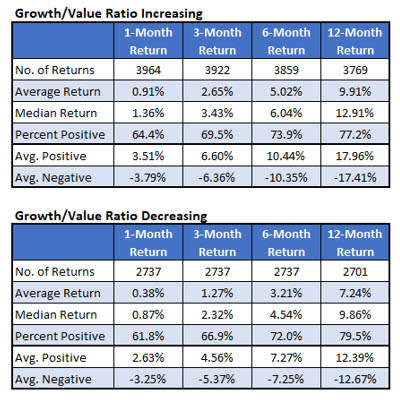
We have daily data for these two indexes since late 1992 (we have monthly data before that back to 1975). For this study, I looked at how the S&P 500 Index (SPX) has performed going forward based on whether the growth/value ratio was increasing or decreasing. I determined this by whether the ratio was above its 200-day moving average (increasing) or below it (decreasing).
Comparing the two tables below, stocks have outperformed when the ratio was increasing -- but not by much. With the ratio increasing, the SPX gained an average of about 5% over the next six months with 74% of the returns positive. When the ratio has been decreasing, the average return is lower, at 3.2%, with 72% of the returns positive. This minor outperformance occurs at every time frame.
I find the volatility numbers intriguing. The SPX has tended to make significantly bigger moves when the ratio has been going up compared to going down. When the ratio has been increasing, the index moved by about 10-11% in either direction over six months (looking at the average positive and negative returns), but when it has been decreasing it has only moved about 7-8% over this time frame.
Individual Stocks to Play
Assuming the growth/value relationship is about to reverse, what stocks should you be rotating out of and into? These lists might get you started.
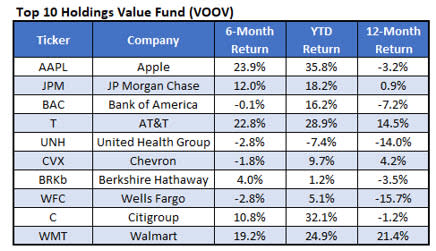
This first list is the top 10 holdings of the Vanguard S&P 500 Value ETF (NYSEARCA:VOOV). This is an ETF that tracks the performance of the S&P 500 Value Index. These stocks have struggled a bit over the past 12 months. As a group, they’ve averaged a slight loss over that time frame, but if the value index is about to start outperforming the growth index, these stocks should be a better bet.
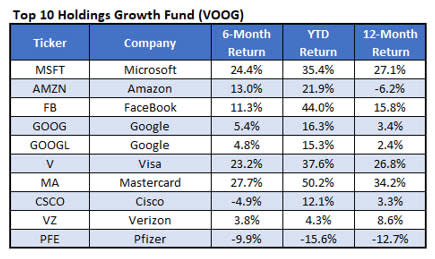
Alternatively, here are the top 10 holdings of the Vanguard S&P 500 Growth ETF (NYSEARCA:VOOG). This ETF tracks the performance of the S&P 500 Growth Index. These stocks have averaged a 10% return over the past 12 months. If you believe the growth/value ratio has peaked, however, you might consider taking the profits and buying up the stocks from the list above.