Do You Like plenum AG (FRA:PLEK) At This P/E Ratio?

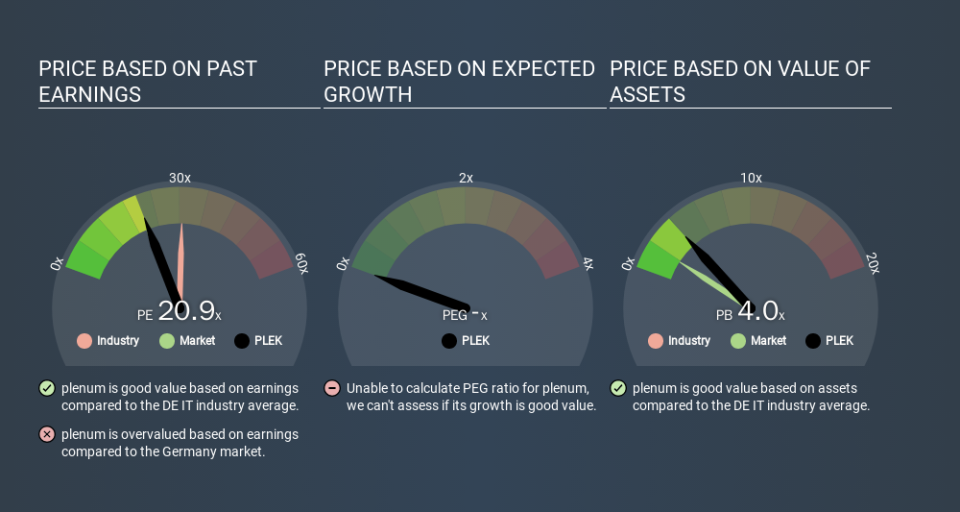
Today, we'll introduce the concept of the P/E ratio for those who are learning about investing. To keep it practical, we'll show how plenum AG's (FRA:PLEK) P/E ratio could help you assess the value on offer. plenum has a price to earnings ratio of 20.90, based on the last twelve months. That corresponds to an earnings yield of approximately 4.8%.
Check out our latest analysis for plenum
How Do You Calculate A P/E Ratio?
The formula for P/E is:
Price to Earnings Ratio = Share Price ÷ Earnings per Share (EPS)
Or for plenum:
P/E of 20.90 = €5.00 ÷ €0.24 (Based on the trailing twelve months to June 2019.)
Is A High Price-to-Earnings Ratio Good?
A higher P/E ratio means that buyers have to pay a higher price for each €1 the company has earned over the last year. That isn't necessarily good or bad, but a high P/E implies relatively high expectations of what a company can achieve in the future.
Does plenum Have A Relatively High Or Low P/E For Its Industry?
One good way to get a quick read on what market participants expect of a company is to look at its P/E ratio. The image below shows that plenum has a lower P/E than the average (30.4) P/E for companies in the it industry.
This suggests that market participants think plenum will underperform other companies in its industry. While current expectations are low, the stock could be undervalued if the situation is better than the market assumes. If you consider the stock interesting, further research is recommended. For example, I often monitor director buying and selling.
How Growth Rates Impact P/E Ratios
Earnings growth rates have a big influence on P/E ratios. If earnings are growing quickly, then the 'E' in the equation will increase faster than it would otherwise. And in that case, the P/E ratio itself will drop rather quickly. And as that P/E ratio drops, the company will look cheap, unless its share price increases.
plenum increased earnings per share by 5.7% last year.
A Limitation: P/E Ratios Ignore Debt and Cash In The Bank
It's important to note that the P/E ratio considers the market capitalization, not the enterprise value. In other words, it does not consider any debt or cash that the company may have on the balance sheet. The exact same company would hypothetically deserve a higher P/E ratio if it had a strong balance sheet, than if it had a weak one with lots of debt, because a cashed up company can spend on growth.
Such spending might be good or bad, overall, but the key point here is that you need to look at debt to understand the P/E ratio in context.
plenum's Balance Sheet
Since plenum holds net cash of €185k, it can spend on growth, justifying a higher P/E ratio than otherwise.
The Bottom Line On plenum's P/E Ratio
plenum trades on a P/E ratio of 20.9, which is fairly close to the DE market average of 20.3. EPS was up modestly better over the last twelve months. Also positive, the relatively strong balance sheet will allow for investment in growth. If this occurs the current P/E might prove to signify undervaluation.
When the market is wrong about a stock, it gives savvy investors an opportunity. As value investor Benjamin Graham famously said, 'In the short run, the market is a voting machine but in the long run, it is a weighing machine. We don't have analyst forecasts, but you might want to assess this data-rich visualization of earnings, revenue and cash flow.
But note: plenum may not be the best stock to buy. So take a peek at this free list of interesting companies with strong recent earnings growth (and a P/E ratio below 20).
If you spot an error that warrants correction, please contact the editor at editorial-team@simplywallst.com. This article by Simply Wall St is general in nature. It does not constitute a recommendation to buy or sell any stock, and does not take account of your objectives, or your financial situation. Simply Wall St has no position in the stocks mentioned.
We aim to bring you long-term focused research analysis driven by fundamental data. Note that our analysis may not factor in the latest price-sensitive company announcements or qualitative material. Thank you for reading.

