Has Prada S.p.A (HKG:1913) Got Enough Cash?

Small-caps and large-caps are wildly popular among investors, however, mid-cap stocks, such as Prada S.p.A (HKG:1913), with a market capitalization of HK$60b, rarely draw their attention from the investing community. However, generally ignored mid-caps have historically delivered better risk-adjusted returns than the two other categories of stocks. 1913’s financial liquidity and debt position will be analysed in this article, to get an idea of whether the company can fund opportunities for strategic growth and maintain strength through economic downturns. Note that this information is centred entirely on financial health and is a top-level understanding, so I encourage you to look further into 1913 here.
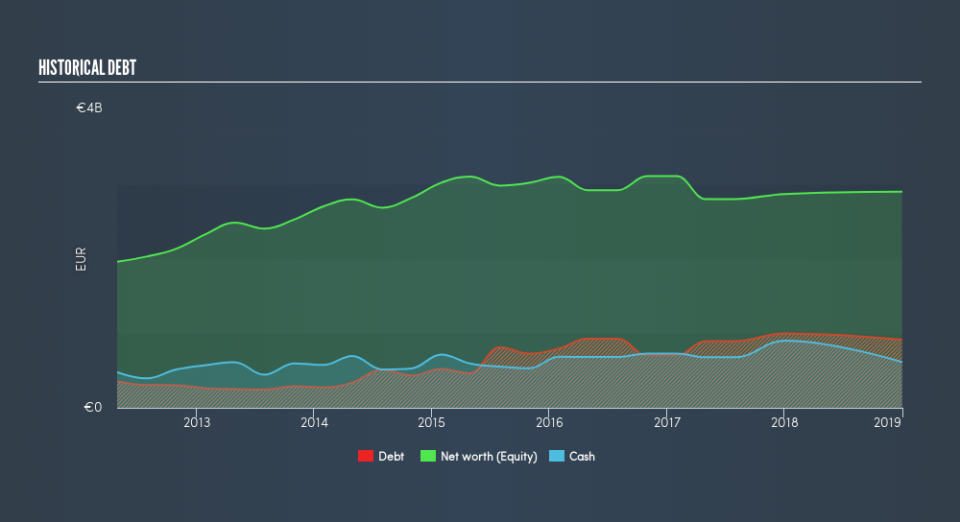
View our latest analysis for Prada
Want to participate in a research study? Help shape the future of investing tools and earn a $60 gift card!
Does 1913 Produce Much Cash Relative To Its Debt?
1913’s debt levels have fallen from €996m to €913m over the last 12 months – this includes long-term debt. With this debt payback, the current cash and short-term investment levels stands at €613m to keep the business going. On top of this, 1913 has produced cash from operations of €365m during the same period of time, resulting in an operating cash to total debt ratio of 40%, signalling that 1913’s debt is appropriately covered by operating cash.
Does 1913’s liquid assets cover its short-term commitments?
With current liabilities at €987m, it seems that the business has maintained a safe level of current assets to meet its obligations, with the current ratio last standing at 1.79x. The current ratio is calculated by dividing current assets by current liabilities. Usually, for Luxury companies, this is a suitable ratio as there’s enough of a cash buffer without holding too much capital in low return investments.
Is 1913’s debt level acceptable?
1913’s level of debt is appropriate relative to its total equity, at 32%. This range is considered safe as 1913 is not taking on too much debt obligation, which can be restrictive and risky for equity-holders. We can check to see whether 1913 is able to meet its debt obligations by looking at the net interest coverage ratio. A company generating earnings before interest and tax (EBIT) at least three times its net interest payments is considered financially sound. In 1913’s, case, the ratio of 15.2x suggests that interest is comfortably covered, which means that lenders may be less hesitant to lend out more funding as 1913’s high interest coverage is seen as responsible and safe practice.
Next Steps:
1913’s high cash coverage and appropriate debt levels indicate its ability to utilise its borrowings efficiently in order to generate ample cash flow. Furthermore, the company will be able to pay all of its upcoming liabilities from its current short-term assets. Keep in mind I haven’t considered other factors such as how 1913 has been performing in the past. You should continue to research Prada to get a more holistic view of the stock by looking at:
Future Outlook: What are well-informed industry analysts predicting for 1913’s future growth? Take a look at our free research report of analyst consensus for 1913’s outlook.
Valuation: What is 1913 worth today? Is the stock undervalued, even when its growth outlook is factored into its intrinsic value? The intrinsic value infographic in our free research report helps visualize whether 1913 is currently mispriced by the market.
Other High-Performing Stocks: Are there other stocks that provide better prospects with proven track records? Explore our free list of these great stocks here.
We aim to bring you long-term focused research analysis driven by fundamental data. Note that our analysis may not factor in the latest price-sensitive company announcements or qualitative material.
If you spot an error that warrants correction, please contact the editor at editorial-team@simplywallst.com. This article by Simply Wall St is general in nature. It does not constitute a recommendation to buy or sell any stock, and does not take account of your objectives, or your financial situation. Simply Wall St has no position in the stocks mentioned. Thank you for reading.
