Price Analysis 22/06: BTC, ETH, XRP, LTC, BCH, EOS, BNB, BSV, XLM, ADA

The views and opinions expressed here are solely those of the author and do not necessarily reflect the views of Cointelegraph. Every investment and trading move involves risk, you should conduct your own research when making a decision.
Market data is provided by the HitBTC exchange.
Bitcoin’s dominance has reached 58.6% and its rally has helped the total market capitalization of cryptocurrencies cross $325 billion. This rise has been backed by an increase in Bitcoin futures open interest that hit an all-time high on the CME on June 17. The recovery from the lows has also helped bitcoin’s hashrate clock a new high. Both these are bullish signs and indicate that the rally is on firm ground.
A new survey by Moscow-based cybersecurity firm Kaspersky Lab has stated that 19% of people across the world have bought cryptocurrencies before 2019. For a new asset class, this is a very high and impressive number. Ripple CEO Brad Garlinghouse recently revealed that he was long on Bitcoin because he considered it a store of value.
While the adoption of cryptocurrencies is increasing, it still has its naysayers. The Reserve Bank of Australia does not expect cryptocurrencies to find wide use in Australia if the existing financial system remains robust. Similarly, Patrick Gaulthier, vice president of Amazon Pay, said that they do not have any plans of creating crypto in the short-term as they do not deal in speculative assets.
With the Bitcoin price topping $11,000, is it a good time to buy or should investors look to other altcoins? Let’s find out.
BTC/USD
The up-move of the past couple of days is reminiscent of the rally during the previous bull market. Bitcoin (BTC) has covered the distance from $10,000 to $11,000 within a day. It has broken out of the ascending channel and looks to be on target to reach the overhead resistance of $12,000. As the price has reversed direction from $12,000 on three occasions, between the end of January and early March of last year, we expect some resistance at this level.
However, when a cryptocurrency is backed by momentum, it is difficult to predict where it will stop.

Both the moving averages are sloping up and the RSI is deep in overbought territory. This suggests that the rally is looking stretched in the short term. However, in early April and mid-May of this year, the RSI had reached just above 88, which shows that there is some more room for the up-move to extend.
If the BTC/USD pair breaks out of $12,000, it can move up to $13,000. But these vertical rallies are unsustainable. Therefore, we anticipate a minor correction or a consolidation for a few days. We do not suggest traders chase the price higher as the risk to reward ratio is not attractive.
ETH/USD
Ether (ETH) broke out of $225.49 to $280 range on June 21. Thereafter, it quickly rallied above the overhead resistance of $322.06 and came very close to its target objective of $335. However, profit booking has pushed the price back below $322.06. This shows a lack of demand at higher levels.

Both the moving averages are sloping up and the RSI is in the overbought zone, which shows that the bulls are in command. If they can propel the ETH/USD pair above $322.06 and sustain it, there is no major resistance until $480.
XRP/USD
Ripple (XRP) has broken out of the symmetrical triangle, which is a positive sign. It can now move up to $0.57259 and above it to $0.6250. Both the moving averages are sloping up and the RSI is in the positive zone, which shows that bulls have the advantage.

Our bullish view will be invalidated if the bulls fail to sustain the breakout and the XRP/USD pair plummets back below $0.450. Until then, every dip will be viewed as a buying opportunity. Traders can trail the stop loss on the long position to $0.41. We will suggest to raise the stop loss again as the price moves up.
LTC/USD
After trading in a small range near $140.3450 for the past few days, the bulls are attempting to resume the uptrend. Litecoin (LTC) has broken out of $140.3450 but is struggling to sustain it. This shows profit booking at higher levels. However, both the moving averages are sloping up and the RSI is close to the overbought zone, which shows that the path of least resistance is to the upside.
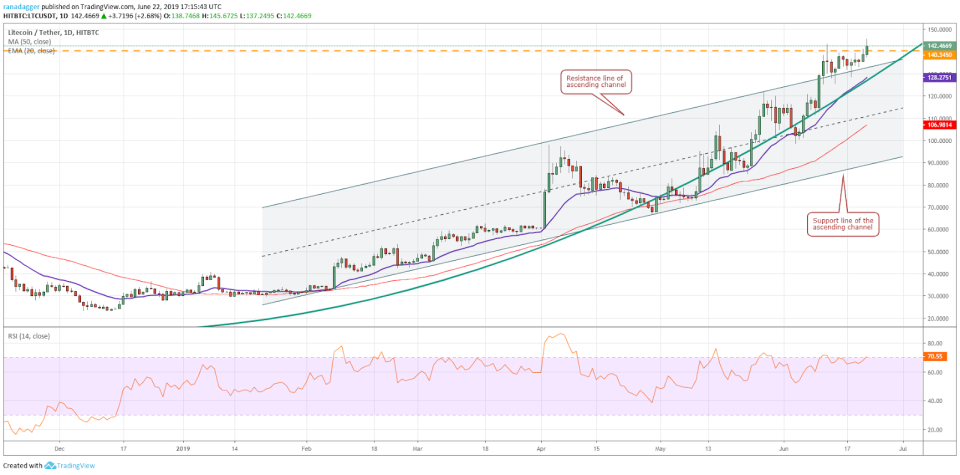
The breakout and close (UTC time frame) above $143.3047 could propel the LTC/USD pair to $158.91 and above it to $184.7949. Conversely, if the pair turns down from current levels and breaks down of the 20-day EMA, momentum will weaken. Therefore, traders can protect the remaining long position with a stop loss below the 20-day EMA. As the price surges higher, traders can tighten the stops further to protect paper profits.
BCH/USD
Bitcoin Cash (BCH) bounced off the 20-day EMA on June 21. Currently, the bulls are trying to sustain above $481.99. If successful, a move to the resistance line of the ascending channel is probable. This might act as a minor hurdle, but if it is crossed, the rally can extend to $639 and above it to $889.

On the other hand, if the BCH/USD pair struggles to break out of the overhead resistance, it might dip back to the 20-day EMA. It remains bullish as long as both the moving averages are sloping up and the price remains above the moving averages. It will signal a change in trend on a breakdown and close (UTC time frame) below the support line of the channel.
EOS/USD
EOS bounced off the 20-day EMA on June 21. It is likely to rally to the resistance line of the channel. If this level is crossed, the next move is toward $8.6503 and above it, $9.30. The 20-day EMA is starting to turn up and the RSI has jumped into positive territory, which suggests that bulls have the upper hand. Traders can trail the stop loss on the long position to $6.40.
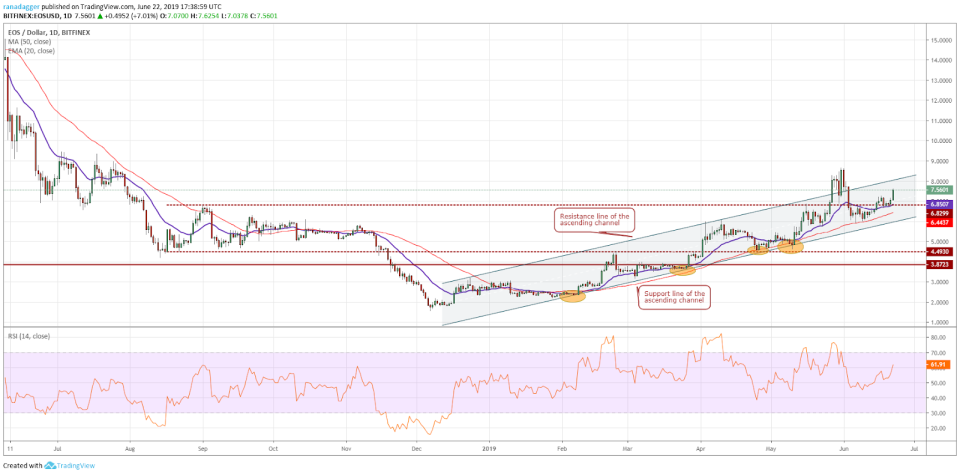
If the EOS/USD pair struggles to break out of the resistance line of the channel or $8.6503, traders can book partial profits on about 50% of the long positions and trail the rest with a tight stop. The momentum will weaken if the price sinks below $6.8299 and the trend will turn bearish on a breakdown of the support line of the ascending channel. This can result in a fall to $4.4930.
BNB/USD
Binance Coin (BNB) has made a new high once again. This is a positive sign as it shows buying at higher levels. The price spiked to $43.2813888, close to our target objective of $46.1645899. However, profit booking at higher levels has dragged the price back near the breakout level of $38.6463356.
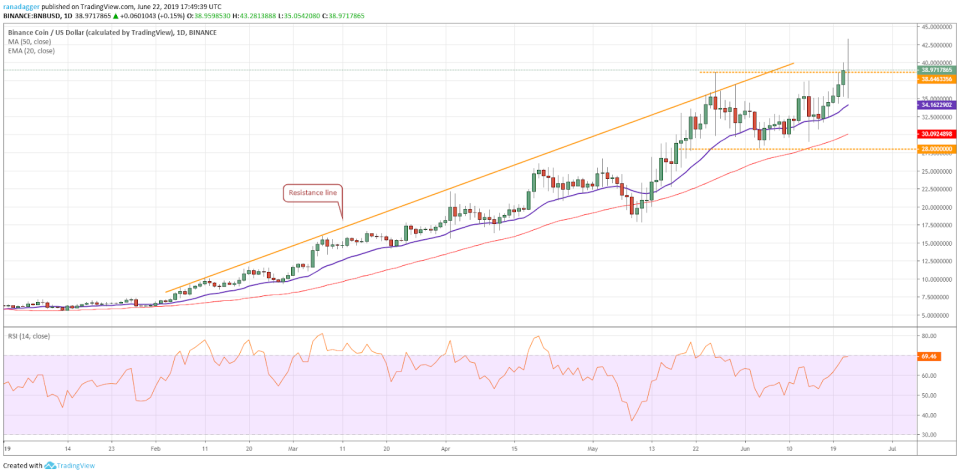
If the bulls defend the support around $38.6463356, we anticipate another attempt to break out of $46.1645899. If successful, a move to $50 is possible, which is likely to act as a psychological resistance.
Traders can book partial profits if the pair hits our target objective and trail the stop loss on the remaining long position to just below the 20-day EMA. However, if the BNB/USD pair plunges much below $38.6463356, it can drop to the 20-day EMA, which is an important support. A break of this support will weaken the momentum.
BSV/USD
Bitcoin SV (BSV) is looking strong as it is attempting to resume its uptrend. It clocked a new high of $255.620 today, but profit booking at higher levels has dragged the price lower. Both the moving averages are sloping up and the RSI is close to the overbought zone, which suggests that the bulls are in command.

If the bulls sustain the rally above $240, the next level to watch is $307.789 and if this level is also scaled, the rally can reach $340.248. However if the BSV/USD pair fails to sustain above $240, it can correct to the 20-day EMA, which is likely to act as a strong support. If this support cracks, the drop can extend to $176.083, which is the 50% retracement of the recent rally.
XLM/USD
Stellar (XLM) has broken out of the downtrend line of the descending triangle. It can now move up to the overhead resistance of $0.14861760. A breakout and close (UTC time frame) above this level will complete an inverse head and shoulders pattern that can start a new uptrend. Therefore, traders can initiate long position as suggested in an earlier analysis.
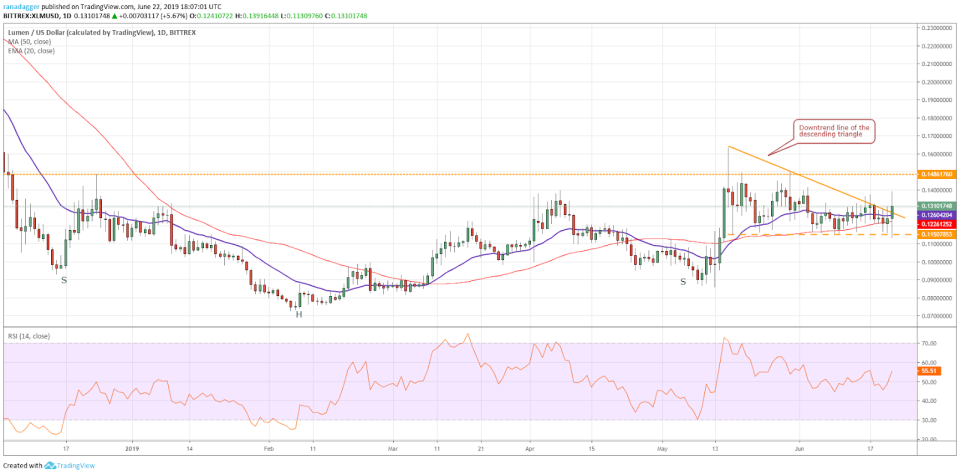
However, both moving averages are flat and the RSI is just above the midpoint, which suggests equilibrium between bulls and bears. The trend will turn in favor of the bears if the XLM/USD pair fails to sustain above the resistance line of the triangle and plunges below $0.11507853. The next support on the downside is at $0.0855.
ADA/USD
Cardano (ADA) is trying to break out of the overhead resistance at $0.10. In the previous five instances, the price had turned down from this resistance. This time, if the bulls succeed in breaking out of $0.10, the cryptocurrency will complete a rounding pattern that has target objective of $0.22466773. Therefore, we retain our buy recommendation given in an earlier analysis.
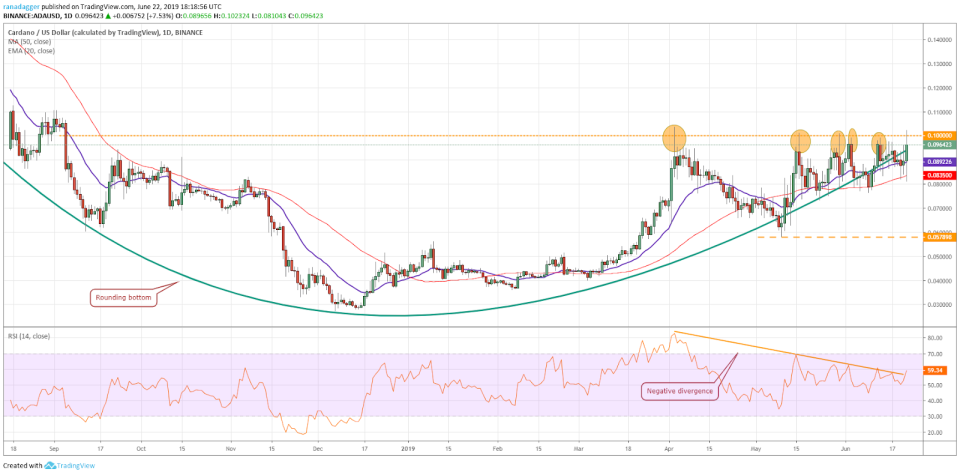
Nevertheless, if the ADA/USD pair fails to break out and close above $0.10, it is likely to remain range bound between $0.076254 and $0.10. The 20-day EMA has flattened out and the RSI is just above 50, which suggests consolidation in the short term. A breakdown of $0.076254 will signal that the bears are back in command.
Market data is provided by the HitBTC exchange. Charts for analysis are provided by TradingView.
