The Progressive Corporation's (NYSE:PGR) high institutional ownership speaks for itself as stock continues to impress, up 5.7% over last week
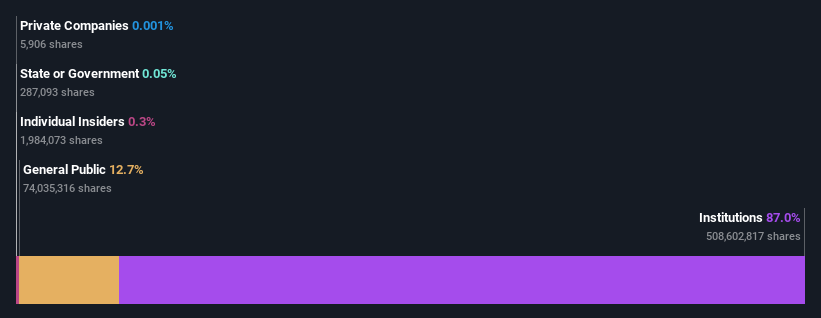
Every investor in The Progressive Corporation (NYSE:PGR) should be aware of the most powerful shareholder groups. And the group that holds the biggest piece of the pie are institutions with 87% ownership. Put another way, the group faces the maximum upside potential (or downside risk).
And as as result, institutional investors reaped the most rewards after the company's stock price gained 5.7% last week. The gains from last week would have further boosted the one-year return to shareholders which currently stand at 30%.
Let's take a closer look to see what the different types of shareholders can tell us about Progressive.
View our latest analysis for Progressive
What Does The Institutional Ownership Tell Us About Progressive?
Many institutions measure their performance against an index that approximates the local market. So they usually pay more attention to companies that are included in major indices.
As you can see, institutional investors have a fair amount of stake in Progressive. This implies the analysts working for those institutions have looked at the stock and they like it. But just like anyone else, they could be wrong. It is not uncommon to see a big share price drop if two large institutional investors try to sell out of a stock at the same time. So it is worth checking the past earnings trajectory of Progressive, (below). Of course, keep in mind that there are other factors to consider, too.
Since institutional investors own more than half the issued stock, the board will likely have to pay attention to their preferences. We note that hedge funds don't have a meaningful investment in Progressive. The company's largest shareholder is The Vanguard Group, Inc., with ownership of 8.4%. BlackRock, Inc. is the second largest shareholder owning 7.2% of common stock, and Wellington Management Group LLP holds about 5.3% of the company stock.
A closer look at our ownership figures suggests that the top 19 shareholders have a combined ownership of 50% implying that no single shareholder has a majority.
While it makes sense to study institutional ownership data for a company, it also makes sense to study analyst sentiments to know which way the wind is blowing. There are plenty of analysts covering the stock, so it might be worth seeing what they are forecasting, too.
Insider Ownership Of Progressive
The definition of company insiders can be subjective and does vary between jurisdictions. Our data reflects individual insiders, capturing board members at the very least. Company management run the business, but the CEO will answer to the board, even if he or she is a member of it.
I generally consider insider ownership to be a good thing. However, on some occasions it makes it more difficult for other shareholders to hold the board accountable for decisions.
Our most recent data indicates that insiders own less than 1% of The Progressive Corporation. Being so large, we would not expect insiders to own a large proportion of the stock. Collectively, they own US$243m of stock. In this sort of situation, it can be more interesting to see if those insiders have been buying or selling.
General Public Ownership
With a 13% ownership, the general public, mostly comprising of individual investors, have some degree of sway over Progressive. While this group can't necessarily call the shots, it can certainly have a real influence on how the company is run.
Next Steps:
It's always worth thinking about the different groups who own shares in a company. But to understand Progressive better, we need to consider many other factors. Be aware that Progressive is showing 2 warning signs in our investment analysis , you should know about...
Ultimately the future is most important. You can access this free report on analyst forecasts for the company.
NB: Figures in this article are calculated using data from the last twelve months, which refer to the 12-month period ending on the last date of the month the financial statement is dated. This may not be consistent with full year annual report figures.
Have feedback on this article? Concerned about the content? Get in touch with us directly. Alternatively, email editorial-team (at) simplywallst.com.
This article by Simply Wall St is general in nature. We provide commentary based on historical data and analyst forecasts only using an unbiased methodology and our articles are not intended to be financial advice. It does not constitute a recommendation to buy or sell any stock, and does not take account of your objectives, or your financial situation. We aim to bring you long-term focused analysis driven by fundamental data. Note that our analysis may not factor in the latest price-sensitive company announcements or qualitative material. Simply Wall St has no position in any stocks mentioned.
Join A Paid User Research Session
You’ll receive a US$30 Amazon Gift card for 1 hour of your time while helping us build better investing tools for the individual investors like yourself. Sign up here
