Przetwórstwo Tworzyw Sztucznych Plast-Box S.A. (WSE:PLX) Delivered A Weaker ROE Than Its Industry

Want to participate in a short research study? Help shape the future of investing tools and you could win a $250 gift card!
Many investors are still learning about the various metrics that can be useful when analysing a stock. This article is for those who would like to learn about Return On Equity (ROE). We'll use ROE to examine Przetwórstwo Tworzyw Sztucznych Plast-Box S.A. (WSE:PLX), by way of a worked example.
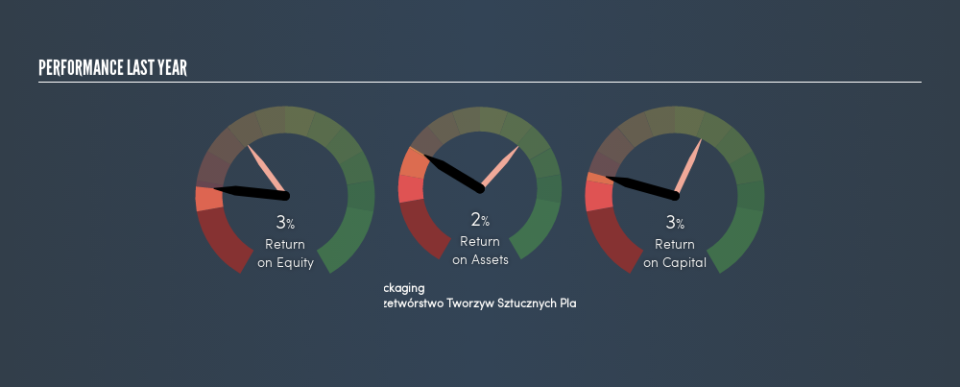
Our data shows Przetwórstwo Tworzyw Sztucznych Plast-Box has a return on equity of 2.6% for the last year. Another way to think of that is that for every PLN1 worth of equity in the company, it was able to earn PLN0.026.
Check out our latest analysis for Przetwórstwo Tworzyw Sztucznych Plast-Box
How Do You Calculate ROE?
The formula for return on equity is:
Return on Equity = Net Profit ÷ Shareholders' Equity
Or for Przetwórstwo Tworzyw Sztucznych Plast-Box:
2.6% = zł1.9m ÷ zł75m (Based on the trailing twelve months to December 2018.)
It's easy to understand the 'net profit' part of that equation, but 'shareholders' equity' requires further explanation. It is the capital paid in by shareholders, plus any retained earnings. You can calculate shareholders' equity by subtracting the company's total liabilities from its total assets.
What Does ROE Signify?
ROE looks at the amount a company earns relative to the money it has kept within the business. The 'return' is the amount earned after tax over the last twelve months. The higher the ROE, the more profit the company is making. So, all else equal, investors should like a high ROE. That means ROE can be used to compare two businesses.
Does Przetwórstwo Tworzyw Sztucznych Plast-Box Have A Good ROE?
One simple way to determine if a company has a good return on equity is to compare it to the average for its industry. Importantly, this is far from a perfect measure, because companies differ significantly within the same industry classification. As is clear from the image below, Przetwórstwo Tworzyw Sztucznych Plast-Box has a lower ROE than the average (10%) in the Packaging industry.
That's not what we like to see. We'd prefer see an ROE above the industry average, but it might not matter if the company is undervalued. Still, shareholders might want to check if insiders have been selling.
How Does Debt Impact Return On Equity?
Virtually all companies need money to invest in the business, to grow profits. That cash can come from retained earnings, issuing new shares (equity), or debt. In the case of the first and second options, the ROE will reflect this use of cash, for growth. In the latter case, the debt required for growth will boost returns, but will not impact the shareholders' equity. Thus the use of debt can improve ROE, albeit along with extra risk in the case of stormy weather, metaphorically speaking.
Combining Przetwórstwo Tworzyw Sztucznych Plast-Box's Debt And Its 2.6% Return On Equity
While Przetwórstwo Tworzyw Sztucznych Plast-Box does have some debt, with debt to equity of just 0.85, we wouldn't say debt is excessive. Its ROE is quite low, and the company already has some debt, so surely shareholders are hoping for an improvement. Careful use of debt to boost returns is often very good for shareholders. However, it could reduce the company's ability to take advantage of future opportunities.
The Bottom Line On ROE
Return on equity is a useful indicator of the ability of a business to generate profits and return them to shareholders. Companies that can achieve high returns on equity without too much debt are generally of good quality. If two companies have the same ROE, then I would generally prefer the one with less debt.
But when a business is high quality, the market often bids it up to a price that reflects this. It is important to consider other factors, such as future profit growth -- and how much investment is required going forward. So I think it may be worth checking this freethis detailed graph of past earnings, revenue and cash flow .
Of course, you might find a fantastic investment by looking elsewhere. So take a peek at this freelist of interesting companies.
We aim to bring you long-term focused research analysis driven by fundamental data. Note that our analysis may not factor in the latest price-sensitive company announcements or qualitative material.
If you spot an error that warrants correction, please contact the editor at editorial-team@simplywallst.com. This article by Simply Wall St is general in nature. It does not constitute a recommendation to buy or sell any stock, and does not take account of your objectives, or your financial situation. Simply Wall St has no position in the stocks mentioned. Thank you for reading.

