Is Public Joint-stock Company "TNS energo Voronezh"'s (MCX:VRSB) High P/E Ratio A Problem For Investors?

This article is written for those who want to get better at using price to earnings ratios (P/E ratios). We'll apply a basic P/E ratio analysis to Public Joint-stock Company "TNS energo Voronezh"'s (MCX:VRSB), to help you decide if the stock is worth further research. What is TNS energo Voronezh's P/E ratio? Well, based on the last twelve months it is 29.87. That corresponds to an earnings yield of approximately 3.3%.
Check out our latest analysis for TNS energo Voronezh
How Do I Calculate A Price To Earnings Ratio?
The formula for price to earnings is:
Price to Earnings Ratio = Price per Share ÷ Earnings per Share (EPS)
Or for TNS energo Voronezh:
P/E of 29.87 = RUB44.600 ÷ RUB1.493 (Based on the year to September 2019.)
(Note: the above calculation results may not be precise due to rounding.)
Is A High Price-to-Earnings Ratio Good?
A higher P/E ratio implies that investors pay a higher price for the earning power of the business. That isn't necessarily good or bad, but a high P/E implies relatively high expectations of what a company can achieve in the future.
How Does TNS energo Voronezh's P/E Ratio Compare To Its Peers?
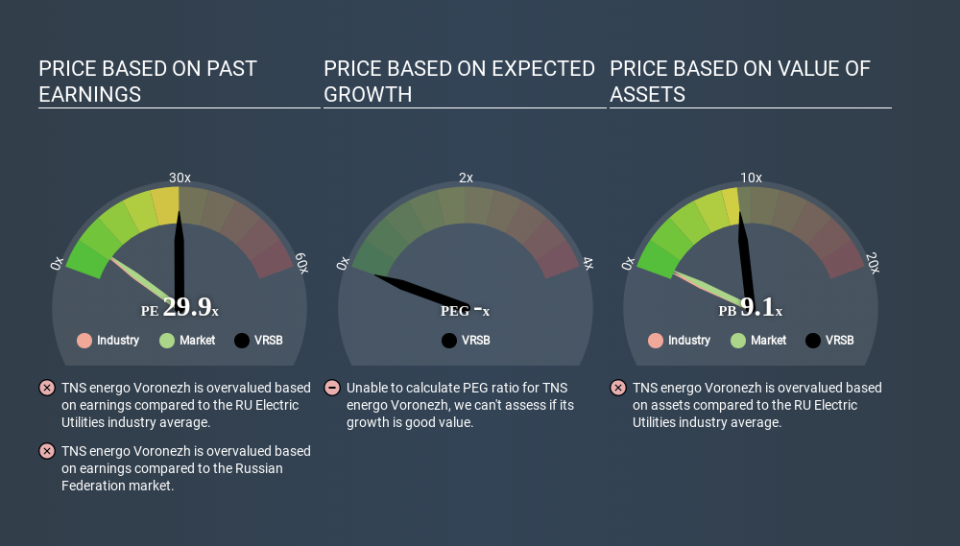
We can get an indication of market expectations by looking at the P/E ratio. The image below shows that TNS energo Voronezh has a significantly higher P/E than the average (6.5) P/E for companies in the electric utilities industry.
Its relatively high P/E ratio indicates that TNS energo Voronezh shareholders think it will perform better than other companies in its industry classification. The market is optimistic about the future, but that doesn't guarantee future growth. So investors should delve deeper. I like to check if company insiders have been buying or selling.
How Growth Rates Impact P/E Ratios
Generally speaking the rate of earnings growth has a profound impact on a company's P/E multiple. When earnings grow, the 'E' increases, over time. That means even if the current P/E is high, it will reduce over time if the share price stays flat. Then, a lower P/E should attract more buyers, pushing the share price up.
TNS energo Voronezh's earnings per share fell by 55% in the last twelve months.
A Limitation: P/E Ratios Ignore Debt and Cash In The Bank
Don't forget that the P/E ratio considers market capitalization. That means it doesn't take debt or cash into account. The exact same company would hypothetically deserve a higher P/E ratio if it had a strong balance sheet, than if it had a weak one with lots of debt, because a cashed up company can spend on growth.
While growth expenditure doesn't always pay off, the point is that it is a good option to have; but one that the P/E ratio ignores.
Is Debt Impacting TNS energo Voronezh's P/E?
TNS energo Voronezh has net debt worth 55% of its market capitalization. If you want to compare its P/E ratio to other companies, you should absolutely keep in mind it has significant borrowings.
The Verdict On TNS energo Voronezh's P/E Ratio
TNS energo Voronezh has a P/E of 29.9. That's significantly higher than the average in its market, which is 7.3. With relatively high debt, and no earnings per share growth over twelve months, it's safe to say the market believes the company will improve its earnings growth in the future.
When the market is wrong about a stock, it gives savvy investors an opportunity. People often underestimate remarkable growth -- so investors can make money when fast growth is not fully appreciated. Although we don't have analyst forecasts you could get a better understanding of its growth by checking out this more detailed historical graph of earnings, revenue and cash flow.
You might be able to find a better buy than TNS energo Voronezh. If you want a selection of possible winners, check out this free list of interesting companies that trade on a P/E below 20 (but have proven they can grow earnings).
If you spot an error that warrants correction, please contact the editor at editorial-team@simplywallst.com. This article by Simply Wall St is general in nature. It does not constitute a recommendation to buy or sell any stock, and does not take account of your objectives, or your financial situation. Simply Wall St has no position in the stocks mentioned.
We aim to bring you long-term focused research analysis driven by fundamental data. Note that our analysis may not factor in the latest price-sensitive company announcements or qualitative material. Thank you for reading.

