Is Punjab Chemicals and Crop Protection Limited's (NSE:PUNJABCHEM) High P/E Ratio A Problem For Investors?

The goal of this article is to teach you how to use price to earnings ratios (P/E ratios). We'll look at Punjab Chemicals and Crop Protection Limited's (NSE:PUNJABCHEM) P/E ratio and reflect on what it tells us about the company's share price. Looking at earnings over the last twelve months, Punjab Chemicals and Crop Protection has a P/E ratio of 33.59. That means that at current prices, buyers pay ₹33.59 for every ₹1 in trailing yearly profits.
Check out our latest analysis for Punjab Chemicals and Crop Protection
How Do You Calculate A P/E Ratio?
The formula for P/E is:
Price to Earnings Ratio = Share Price ÷ Earnings per Share (EPS)
Or for Punjab Chemicals and Crop Protection:
P/E of 33.59 = ₹460.15 ÷ ₹13.7 (Based on the trailing twelve months to March 2019.)
Is A High P/E Ratio Good?
The higher the P/E ratio, the higher the price tag of a business, relative to its trailing earnings. That is not a good or a bad thing per se, but a high P/E does imply buyers are optimistic about the future.
Does Punjab Chemicals and Crop Protection Have A Relatively High Or Low P/E For Its Industry?
The P/E ratio indicates whether the market has higher or lower expectations of a company. As you can see below, Punjab Chemicals and Crop Protection has a higher P/E than the average company (11.7) in the chemicals industry.
Its relatively high P/E ratio indicates that Punjab Chemicals and Crop Protection shareholders think it will perform better than other companies in its industry classification. Clearly the market expects growth, but it isn't guaranteed. So investors should always consider the P/E ratio alongside other factors, such as whether company directors have been buying shares.
How Growth Rates Impact P/E Ratios
Probably the most important factor in determining what P/E a company trades on is the earnings growth. When earnings grow, the 'E' increases, over time. Therefore, even if you pay a high multiple of earnings now, that multiple will become lower in the future. And as that P/E ratio drops, the company will look cheap, unless its share price increases.
Punjab Chemicals and Crop Protection's earnings per share fell by 2.2% in the last twelve months. But over the longer term (5 years) earnings per share have increased by 77%.
A Limitation: P/E Ratios Ignore Debt and Cash In The Bank
It's important to note that the P/E ratio considers the market capitalization, not the enterprise value. Thus, the metric does not reflect cash or debt held by the company. Hypothetically, a company could reduce its future P/E ratio by spending its cash (or taking on debt) to achieve higher earnings.
Spending on growth might be good or bad a few years later, but the point is that the P/E ratio does not account for the option (or lack thereof).
Is Debt Impacting Punjab Chemicals and Crop Protection's P/E?
Punjab Chemicals and Crop Protection has net debt worth 15% of its market capitalization. This could bring some additional risk, and reduce the number of investment options for management; worth remembering if you compare its P/E to businesses without debt.
The Verdict On Punjab Chemicals and Crop Protection's P/E Ratio
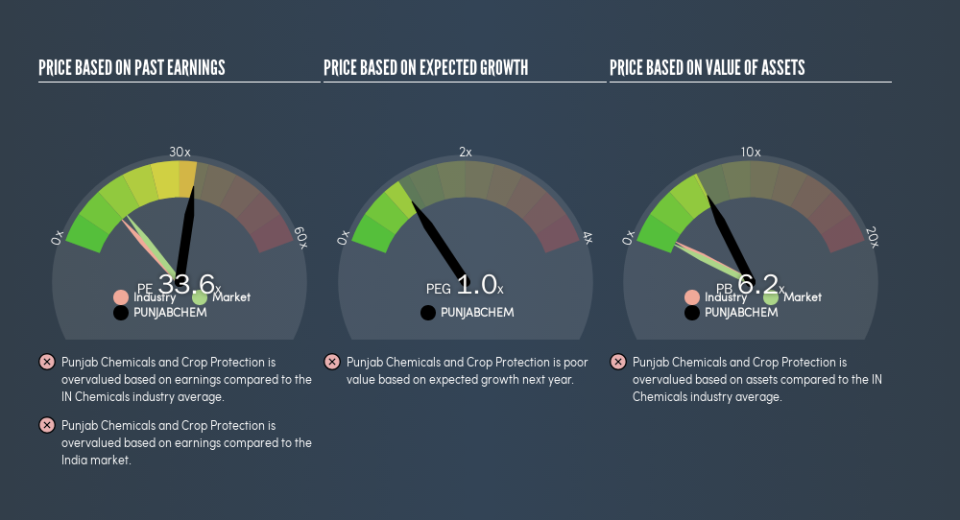
Punjab Chemicals and Crop Protection has a P/E of 33.6. That's higher than the average in its market, which is 13.6. With modest debt but no EPS growth in the last year, it's fair to say the P/E implies some optimism about future earnings, from the market.
Investors have an opportunity when market expectations about a stock are wrong. People often underestimate remarkable growth -- so investors can make money when fast growth is not fully appreciated. So this free report on the analyst consensus forecasts could help you make a master move on this stock.
But note: Punjab Chemicals and Crop Protection may not be the best stock to buy. So take a peek at this free list of interesting companies with strong recent earnings growth (and a P/E ratio below 20).
We aim to bring you long-term focused research analysis driven by fundamental data. Note that our analysis may not factor in the latest price-sensitive company announcements or qualitative material.
If you spot an error that warrants correction, please contact the editor at editorial-team@simplywallst.com. This article by Simply Wall St is general in nature. It does not constitute a recommendation to buy or sell any stock, and does not take account of your objectives, or your financial situation. Simply Wall St has no position in the stocks mentioned. Thank you for reading.
