Put Trader Targets XLF for Pre-Fed Roll
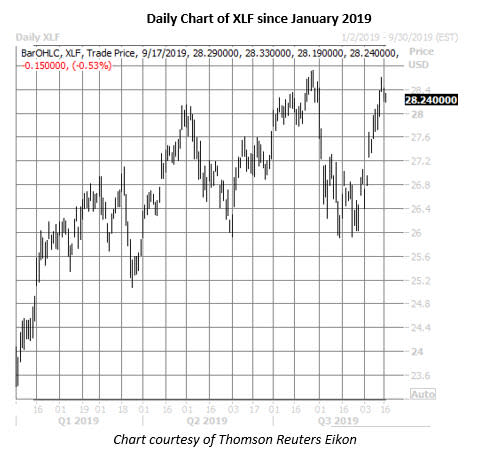
Bank stocks have roared higher in September, with the Financial Select Sector SPDR Fund (XLF) up roughly 9% since a late-August bounce off familiar support near $26. The fund gapped above the $27 level earlier this month as the broader equities market rallied on upbeat U.S.-China trade headlines, and strung together a five-day winning streak last week. And this positive price action may be what prompted one options trader to adjust their bearish bet on Monday, ahead of this week's Fed meeting.
Diving deeper, XLF put volume ran at four times the average daily pace yesterday, with around 372,000 contracts exchanged. The December 22 and 25 puts were most active, due to one trader closing out long put spreads that were initially bought in early August when XLF was trading near $26.75, according to Trade-Alert.
Meanwhile, it looks like the trader rolled this long put spread up to the December 24 and 27 strikes, with Trade-Alert pegging the net debit paid at $0.445 per spread. If this is the case, XLF will ideally settle right at $24 -- near its year-to-date breakeven mark -- at the close on Friday, Dec. 20, when the options expire, allowing the spread strategist to collect the maximum potential reward of $1.335 per spread, which is the difference between the two strikes, less the net debit.
However, the long put spread trader can still profit if XLF drops below breakeven at $26.555 (bought 27 strike less premium paid). On the flip side, the speculator could lose their initial net debit as the full potential loss, should the shares remain above $27 through expiration.
Today, XLF shares are down 0.5% to trade at $28.24, as the two-day Federal Open Market Committee (FOMC) policy-setting meeting gets underway, though expectations for a rate cut tomorrow have dropped dramatically over the past week. In the options pits, around 37,000 puts and 27,000 calls have changed hands, with traders possibly selling to open October 27 puts.

