Is Qilu Expressway Company Limited's (HKG:1576) P/E Ratio Really That Good?

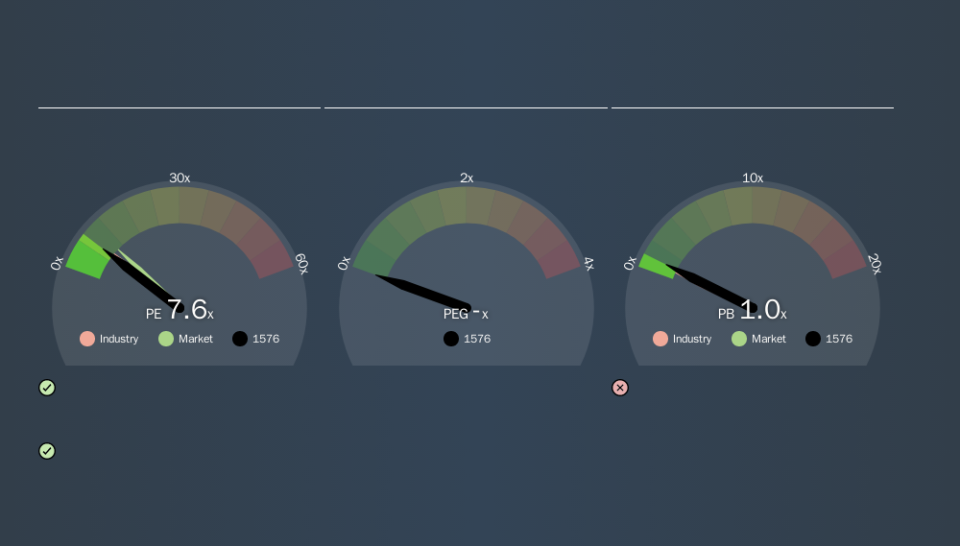
The goal of this article is to teach you how to use price to earnings ratios (P/E ratios). We'll look at Qilu Expressway Company Limited's (HKG:1576) P/E ratio and reflect on what it tells us about the company's share price. What is Qilu Expressway's P/E ratio? Well, based on the last twelve months it is 7.61. That is equivalent to an earnings yield of about 13.1%.
See our latest analysis for Qilu Expressway
How Do You Calculate A P/E Ratio?
The formula for P/E is:
Price to Earnings Ratio = Price per Share (in the reporting currency) ÷ Earnings per Share (EPS)
Or for Qilu Expressway:
P/E of 7.61 = HK$1.67 (Note: this is the share price in the reporting currency, namely, CNY ) ÷ HK$0.22 (Based on the year to June 2019.)
Is A High Price-to-Earnings Ratio Good?
A higher P/E ratio implies that investors pay a higher price for the earning power of the business. That isn't necessarily good or bad, but a high P/E implies relatively high expectations of what a company can achieve in the future.
Does Qilu Expressway Have A Relatively High Or Low P/E For Its Industry?
The P/E ratio essentially measures market expectations of a company. If you look at the image below, you can see Qilu Expressway has a lower P/E than the average (8.4) in the infrastructure industry classification.
This suggests that market participants think Qilu Expressway will underperform other companies in its industry. Many investors like to buy stocks when the market is pessimistic about their prospects. If you consider the stock interesting, further research is recommended. For example, I often monitor director buying and selling.
How Growth Rates Impact P/E Ratios
Earnings growth rates have a big influence on P/E ratios. That's because companies that grow earnings per share quickly will rapidly increase the 'E' in the equation. That means unless the share price increases, the P/E will reduce in a few years. So while a stock may look expensive based on past earnings, it could be cheap based on future earnings.
Qilu Expressway's earnings per share fell by 25% in the last twelve months. But EPS is up 5.8% over the last 5 years.
Remember: P/E Ratios Don't Consider The Balance Sheet
One drawback of using a P/E ratio is that it considers market capitalization, but not the balance sheet. So it won't reflect the advantage of cash, or disadvantage of debt. In theory, a company can lower its future P/E ratio by using cash or debt to invest in growth.
While growth expenditure doesn't always pay off, the point is that it is a good option to have; but one that the P/E ratio ignores.
How Does Qilu Expressway's Debt Impact Its P/E Ratio?
With net cash of CN¥1.3b, Qilu Expressway has a very strong balance sheet, which may be important for its business. Having said that, at 37% of its market capitalization the cash hoard would contribute towards a higher P/E ratio.
The Bottom Line On Qilu Expressway's P/E Ratio
Qilu Expressway has a P/E of 7.6. That's below the average in the HK market, which is 10.1. The recent drop in earnings per share would make investors cautious, but the net cash position means the company has time to improve: if so, the low P/E could be an opportunity.
Investors have an opportunity when market expectations about a stock are wrong. If the reality for a company is not as bad as the P/E ratio indicates, then the share price should increase as the market realizes this. Although we don't have analyst forecasts you could get a better understanding of its growth by checking out this more detailed historical graph of earnings, revenue and cash flow.
But note: Qilu Expressway may not be the best stock to buy. So take a peek at this free list of interesting companies with strong recent earnings growth (and a P/E ratio below 20).
We aim to bring you long-term focused research analysis driven by fundamental data. Note that our analysis may not factor in the latest price-sensitive company announcements or qualitative material.
If you spot an error that warrants correction, please contact the editor at editorial-team@simplywallst.com. This article by Simply Wall St is general in nature. It does not constitute a recommendation to buy or sell any stock, and does not take account of your objectives, or your financial situation. Simply Wall St has no position in the stocks mentioned. Thank you for reading.
