Is Quest Diagnostics Incorporated (NYSE:DGX) A Smart Pick For Income Investors?

Want to participate in a short research study? Help shape the future of investing tools and you could win a $250 gift card!
Today we'll take a closer look at Quest Diagnostics Incorporated (NYSE:DGX) from a dividend investor's perspective. Owning a strong business and reinvesting the dividends is widely seen as an attractive way of growing your wealth. Unfortunately, it's common for investors to be enticed in by the seemingly attractive yield, and lose money when the company has to cut its dividend payments.
A 2.1% yield is nothing to get excited about, but investors probably think the long payment history suggests Quest Diagnostics has some staying power. The company also bought back stock during the year, equivalent to approximately 1.9% of the company's market capitalisation at the time. When buying stocks for their dividends, you should always run through the checks below, to see if the dividend looks sustainable.
Explore this interactive chart for our latest analysis on Quest Diagnostics!
Payout ratios
Companies (usually) pay dividends out of their earnings. If a company is paying more than it earns, the dividend might have to be cut. As a result, we should always investigate whether a company can afford its dividend, measured as a percentage of a company's net income after tax. Quest Diagnostics paid out 39% of its profit as dividends, over the trailing twelve month period. This is medium payout level that leaves enough capital in the business to fund opportunities that might arise, while also rewarding shareholders. Besides, if reinvestment opportunities dry up, the company has room to increase the dividend.
In addition to comparing dividends against profits, we should inspect whether the company generated enough cash to pay its dividend. Quest Diagnostics's cash payout ratio in the last year was 30%, which suggests dividends were well covered by cash generated by the business. It's encouraging to see that the dividend is covered by both profit and cash flow. This generally suggests the dividend is sustainable, as long as earnings don't drop precipitously.
Is Quest Diagnostics's Balance Sheet Risky?
As Quest Diagnostics has a meaningful amount of debt, we need to check its balance sheet to see if the company might have debt risks. A rough way to check this is with these two simple ratios: a) net debt divided by EBITDA (earnings before interest, tax, depreciation and amortisation), and b) net interest cover. Net debt to EBITDA measures a company's total debt load relative to its earnings (lower = less debt), while net interest cover measures the company's ability to pay the interest on its debt (higher = greater ability to pay interest costs). Quest Diagnostics has net debt of 2.57 times its earnings before interest, tax, depreciation, and amortisation (EBITDA). Using debt can accelerate business growth, but also increases the risks.
We calculated its interest cover by measuring its earnings before interest and tax (EBIT), and dividing this by the company's net interest expense. Net interest cover of 6.95 times its interest expense appears reasonable for Quest Diagnostics, although we're conscious that even high interest cover doesn't make a company bulletproof.
We update our data on Quest Diagnostics every 24 hours, so you can always get our latest analysis of its financial health, here.
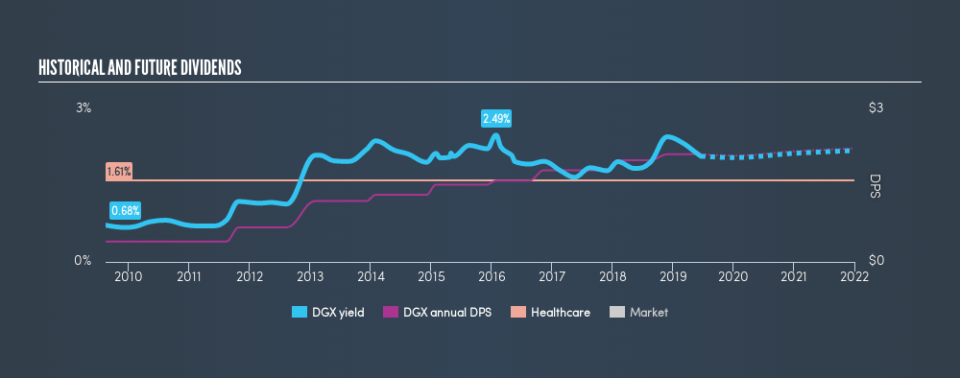
Dividend Volatility
Before buying a stock for its income, we want to see if the dividends have been stable in the past, and if the company has a track record of maintaining its dividend. Quest Diagnostics has been paying dividends for a long time, but for the purpose of this analysis, we only examine the past 10 years of payments. The dividend has been stable over the past 10 years, which is great. We think this could suggest some resilience to the business and its dividends. During the past ten-year period, the first annual payment was US$0.40 in 2009, compared to US$2.12 last year. Dividends per share have grown at approximately 18% per year over this time.
Dividends have been growing pretty quickly, and even more impressively, they haven't experienced any notable falls during this period.
Dividend Growth Potential
Dividend payments have been consistent over the past few years, but we should always check if earnings per share (EPS) are growing, as this will help maintain the purchasing power of the dividend. Quest Diagnostics's earnings per share have been essentially flat over the past five years. Over the long term, steady earnings per share is a risk as the value of the dividends can be reduced by inflation.
Conclusion
When we look at a dividend stock, we need to form a judgement on whether the dividend will grow, if the company is able to maintain it in a wide range of economic circumstances, and if the dividend payout is sustainable. It's great to see that Quest Diagnostics is paying out a low percentage of its earnings and cash flow. Moreover, earnings have been shrinking. While the dividends have been fairly steady, we'd wonder for how much longer this will be sustainable if earnings continue to decline. Overall we think Quest Diagnostics is an interesting dividend stock, although it could be better.
Without at least some growth in earnings per share over time, the dividend will eventually come under pressure either from costs or inflation. Businesses can change though, and we think it would make sense to see what analysts are forecasting for the company.
Looking for more high-yielding dividend ideas? Try our curated list of dividend stocks with a yield above 3%.
We aim to bring you long-term focused research analysis driven by fundamental data. Note that our analysis may not factor in the latest price-sensitive company announcements or qualitative material.
If you spot an error that warrants correction, please contact the editor at editorial-team@simplywallst.com. This article by Simply Wall St is general in nature. It does not constitute a recommendation to buy or sell any stock, and does not take account of your objectives, or your financial situation. Simply Wall St has no position in the stocks mentioned. Thank you for reading.
