Quick Take Technical Analysis: Chewy, Inc
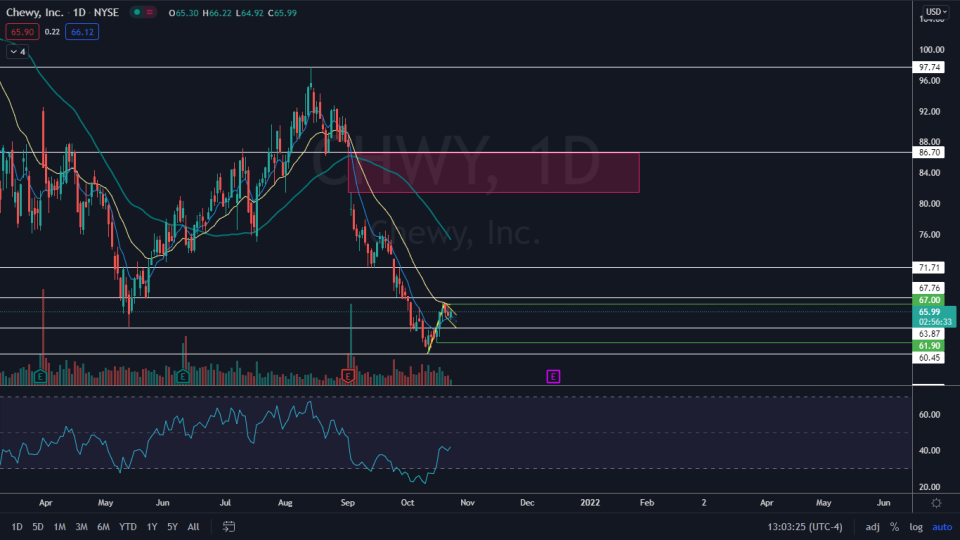
Chewy, Inc (NYSE: CHWY) reached a high of $97.74 on Aug. 13 before entering into a steep downtrend, which was exacerbated by a bearish reaction to its second-quarter earnings print on Sept. 2. The stock then hit a bottom on Oct. 12 and bounced up, which indicated a trend change may be in the works.
Chewy is now trading in a confirmed uptrend after printing an Oct. 20 high of $67, which was above the previous lower high of $66.52 made on Oct. 7.
The stock may be settling into a bull flag pattern on the daily chart, with the pole created between Oct. 12 and Oct. 20 and the flag between Wednesday and Friday.
If the bull flag pattern is recognized the measured move, calculated by determining the length of the pole, is about 10%, which indicates Chewy could trade up toward the $71 mark in the future.
There is a gap above between $81.37 and $86.60, and because gaps fill about 90% of the time it is likely Chewy will trade up into the range in the future.
Chewy must hold above the $61.90 level to maintain the uptrend.
There is resistance above at $67.76 and $71.71 and support below at $63.87 and $60.45.
Want direct analysis? Find me in the BZ Pro lounge! Click here for a free trial.
See more from Benzinga
© 2021 Benzinga.com. Benzinga does not provide investment advice. All rights reserved.

