Is Ramelius Resources Limited's (ASX:RMS) Stock's Recent Performance Being Led By Its Attractive Financial Prospects?

Ramelius Resources (ASX:RMS) has had a great run on the share market with its stock up by a significant 17% over the last month. Given the company's impressive performance, we decided to study its financial indicators more closely as a company's financial health over the long-term usually dictates market outcomes. Particularly, we will be paying attention to Ramelius Resources' ROE today.
Return on equity or ROE is a key measure used to assess how efficiently a company's management is utilizing the company's capital. Put another way, it reveals the company's success at turning shareholder investments into profits.
Check out our latest analysis for Ramelius Resources
How To Calculate Return On Equity?
ROE can be calculated by using the formula:
Return on Equity = Net Profit (from continuing operations) ÷ Shareholders' Equity
So, based on the above formula, the ROE for Ramelius Resources is:
22% = AU$113m ÷ AU$515m (Based on the trailing twelve months to June 2020).
The 'return' is the income the business earned over the last year. So, this means that for every A$1 of its shareholder's investments, the company generates a profit of A$0.22.
What Has ROE Got To Do With Earnings Growth?
So far, we've learned that ROE is a measure of a company's profitability. We now need to evaluate how much profit the company reinvests or "retains" for future growth which then gives us an idea about the growth potential of the company. Assuming all else is equal, companies that have both a higher return on equity and higher profit retention are usually the ones that have a higher growth rate when compared to companies that don't have the same features.
Ramelius Resources' Earnings Growth And 22% ROE
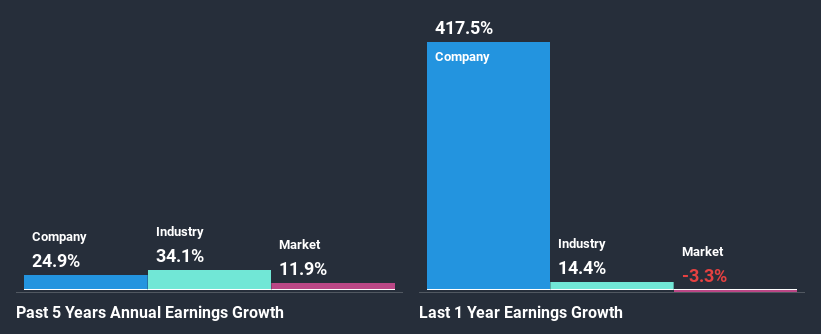
To start with, Ramelius Resources' ROE looks acceptable. Further, the company's ROE compares quite favorably to the industry average of 13%. This probably laid the ground for Ramelius Resources' significant 25% net income growth seen over the past five years. We reckon that there could also be other factors at play here. Such as - high earnings retention or an efficient management in place.
As a next step, we compared Ramelius Resources' net income growth with the industry and were disappointed to see that the company's growth is lower than the industry average growth of 34% in the same period.
Earnings growth is a huge factor in stock valuation. The investor should try to establish if the expected growth or decline in earnings, whichever the case may be, is priced in. Doing so will help them establish if the stock's future looks promising or ominous. If you're wondering about Ramelius Resources''s valuation, check out this gauge of its price-to-earnings ratio, as compared to its industry.
Is Ramelius Resources Making Efficient Use Of Its Profits?
Ramelius Resources has a really low three-year median payout ratio of 17%, meaning that it has the remaining 83% left over to reinvest into its business. So it looks like Ramelius Resources is reinvesting profits heavily to grow its business, which shows in its earnings growth.
While Ramelius Resources has seen growth in its earnings, it only recently started to pay a dividend. It is most likely that the company decided to impress new and existing shareholders with a dividend. Upon studying the latest analysts' consensus data, we found that the company's future payout ratio is expected to rise to 23% over the next three years. Despite the higher expected payout ratio, the company's ROE is not expected to change by much.
Conclusion
In total, we are pretty happy with Ramelius Resources' performance. Particularly, we like that the company is reinvesting heavily into its business, and at a high rate of return. As a result, the decent growth in its earnings is not surprising. With that said, the latest industry analyst forecasts reveal that the company's earnings growth is expected to slow down. To know more about the latest analysts predictions for the company, check out this visualization of analyst forecasts for the company.
This article by Simply Wall St is general in nature. It does not constitute a recommendation to buy or sell any stock, and does not take account of your objectives, or your financial situation. We aim to bring you long-term focused analysis driven by fundamental data. Note that our analysis may not factor in the latest price-sensitive company announcements or qualitative material. Simply Wall St has no position in any stocks mentioned.
Have feedback on this article? Concerned about the content? Get in touch with us directly. Alternatively, email editorial-team@simplywallst.com.

