Can Rare Earth Magnesium Technology Group Holdings Limited (HKG:601) Maintain Its Strong Returns?

Want to participate in a short research study? Help shape the future of investing tools and you could win a $250 gift card!
One of the best investments we can make is in our own knowledge and skill set. With that in mind, this article will work through how we can use Return On Equity (ROE) to better understand a business. To keep the lesson grounded in practicality, we'll use ROE to better understand Rare Earth Magnesium Technology Group Holdings Limited (HKG:601).
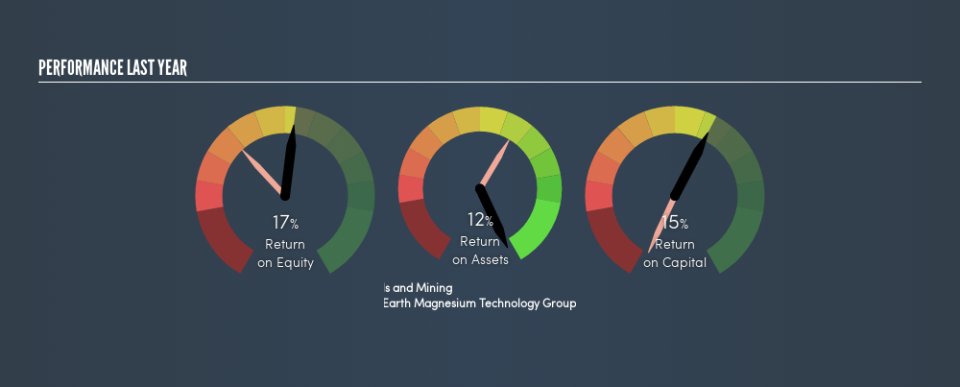
Our data shows Rare Earth Magnesium Technology Group Holdings has a return on equity of 17% for the last year. One way to conceptualize this, is that for each HK$1 of shareholders' equity it has, the company made HK$0.17 in profit.
See our latest analysis for Rare Earth Magnesium Technology Group Holdings
How Do You Calculate Return On Equity?
The formula for return on equity is:
Return on Equity = Net Profit ÷ Shareholders' Equity
Or for Rare Earth Magnesium Technology Group Holdings:
17% = HK$218m ÷ HK$1.3b (Based on the trailing twelve months to December 2018.)
Most know that net profit is the total earnings after all expenses, but the concept of shareholders' equity is a little more complicated. It is all the money paid into the company from shareholders, plus any earnings retained. You can calculate shareholders' equity by subtracting the company's total liabilities from its total assets.
What Does Return On Equity Signify?
ROE measures a company's profitability against the profit it retains, and any outside investments. The 'return' is the yearly profit. The higher the ROE, the more profit the company is making. So, all else equal, investors should like a high ROE. Clearly, then, one can use ROE to compare different companies.
Does Rare Earth Magnesium Technology Group Holdings Have A Good ROE?
By comparing a company's ROE with its industry average, we can get a quick measure of how good it is. Importantly, this is far from a perfect measure, because companies differ significantly within the same industry classification. Pleasingly, Rare Earth Magnesium Technology Group Holdings has a superior ROE than the average (9.1%) company in the Metals and Mining industry.
That is a good sign. I usually take a closer look when a company has a better ROE than industry peers. One data point to check is if insiders have bought shares recently.
Why You Should Consider Debt When Looking At ROE
Companies usually need to invest money to grow their profits. That cash can come from retained earnings, issuing new shares (equity), or debt. In the first and second cases, the ROE will reflect this use of cash for investment in the business. In the latter case, the debt required for growth will boost returns, but will not impact the shareholders' equity. That will make the ROE look better than if no debt was used.
Rare Earth Magnesium Technology Group Holdings's Debt And Its 17% ROE
Rare Earth Magnesium Technology Group Holdings has a debt to equity ratio of 0.72, which is far from excessive. The fact that it achieved a fairly good ROE with only modest debt suggests the business might be worth putting on your watchlist. Judicious use of debt to improve returns can certainly be a good thing, although it does elevate risk slightly and reduce future optionality.
But It's Just One Metric
Return on equity is a useful indicator of the ability of a business to generate profits and return them to shareholders. In my book the highest quality companies have high return on equity, despite low debt. If two companies have the same ROE, then I would generally prefer the one with less debt.
But when a business is high quality, the market often bids it up to a price that reflects this. The rate at which profits are likely to grow, relative to the expectations of profit growth reflected in the current price, must be considered, too. You can see how the company has grow in the past by looking at this FREE detailed graph of past earnings, revenue and cash flow.
Of course, you might find a fantastic investment by looking elsewhere. So take a peek at this free list of interesting companies.
We aim to bring you long-term focused research analysis driven by fundamental data. Note that our analysis may not factor in the latest price-sensitive company announcements or qualitative material.
If you spot an error that warrants correction, please contact the editor at editorial-team@simplywallst.com. This article by Simply Wall St is general in nature. It does not constitute a recommendation to buy or sell any stock, and does not take account of your objectives, or your financial situation. Simply Wall St has no position in the stocks mentioned. Thank you for reading.

