Read This Before You Buy CES Energy Solutions Corp. (TSE:CEU) Because Of Its P/E Ratio

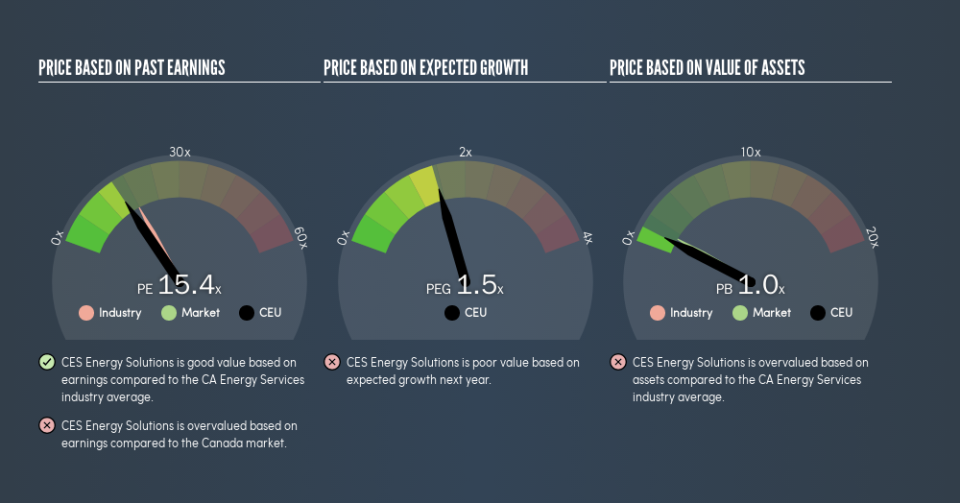
The goal of this article is to teach you how to use price to earnings ratios (P/E ratios). We'll look at CES Energy Solutions Corp.'s (TSE:CEU) P/E ratio and reflect on what it tells us about the company's share price. CES Energy Solutions has a price to earnings ratio of 15.44, based on the last twelve months. That means that at current prices, buyers pay CA$15.44 for every CA$1 in trailing yearly profits.
See our latest analysis for CES Energy Solutions
How Do You Calculate A P/E Ratio?
The formula for price to earnings is:
Price to Earnings Ratio = Price per Share ÷ Earnings per Share (EPS)
Or for CES Energy Solutions:
P/E of 15.44 = CA$2.75 ÷ CA$0.18 (Based on the trailing twelve months to December 2018.)
Is A High Price-to-Earnings Ratio Good?
A higher P/E ratio means that investors are paying a higher price for each CA$1 of company earnings. That isn't necessarily good or bad, but a high P/E implies relatively high expectations of what a company can achieve in the future.
How Growth Rates Impact P/E Ratios
Earnings growth rates have a big influence on P/E ratios. Earnings growth means that in the future the 'E' will be higher. That means even if the current P/E is high, it will reduce over time if the share price stays flat. Then, a lower P/E should attract more buyers, pushing the share price up.
Notably, CES Energy Solutions grew EPS by a whopping 31% in the last year. But earnings per share are down 1.9% per year over the last five years.
How Does CES Energy Solutions's P/E Ratio Compare To Its Peers?
We can get an indication of market expectations by looking at the P/E ratio. If you look at the image below, you can see CES Energy Solutions has a lower P/E than the average (18.2) in the energy services industry classification.
CES Energy Solutions's P/E tells us that market participants think it will not fare as well as its peers in the same industry. Many investors like to buy stocks when the market is pessimistic about their prospects. It is arguably worth checking if insiders are buying shares, because that might imply they believe the stock is undervalued.
A Limitation: P/E Ratios Ignore Debt and Cash In The Bank
The 'Price' in P/E reflects the market capitalization of the company. That means it doesn't take debt or cash into account. Theoretically, a business can improve its earnings (and produce a lower P/E in the future) by investing in growth. That means taking on debt (or spending its cash).
Such expenditure might be good or bad, in the long term, but the point here is that the balance sheet is not reflected by this ratio.
CES Energy Solutions's Balance Sheet
Net debt totals 67% of CES Energy Solutions's market cap. This is enough debt that you'd have to make some adjustments before using the P/E ratio to compare it to a company with net cash.
The Bottom Line On CES Energy Solutions's P/E Ratio
CES Energy Solutions has a P/E of 15.4. That's around the same as the average in the CA market, which is 15.3. While it does have meaningful debt levels, it has also produced strong earnings growth recently. The P/E suggests that the market is not convinced EPS will continue to improve strongly.
When the market is wrong about a stock, it gives savvy investors an opportunity. If the reality for a company is better than it expects, you can make money by buying and holding for the long term. So this free visualization of the analyst consensus on future earnings could help you make the right decision about whether to buy, sell, or hold.
You might be able to find a better buy than CES Energy Solutions. If you want a selection of possible winners, check out this free list of interesting companies that trade on a P/E below 20 (but have proven they can grow earnings).
We aim to bring you long-term focused research analysis driven by fundamental data. Note that our analysis may not factor in the latest price-sensitive company announcements or qualitative material.
If you spot an error that warrants correction, please contact the editor at editorial-team@simplywallst.com. This article by Simply Wall St is general in nature. It does not constitute a recommendation to buy or sell any stock, and does not take account of your objectives, or your financial situation. Simply Wall St has no position in the stocks mentioned. Thank you for reading.

