Read This Before You Buy Clearwater Paper Corporation (NYSE:CLW) Because Of Its P/E Ratio

Want to participate in a short research study? Help shape the future of investing tools and receive a $20 prize!
This article is written for those who want to get better at using price to earnings ratios (P/E ratios). We’ll look at Clearwater Paper Corporation’s (NYSE:CLW) P/E ratio and reflect on what it tells us about the company’s share price. Based on the last twelve months, Clearwater Paper’s P/E ratio is 4.48. That means that at current prices, buyers pay $4.48 for every $1 in trailing yearly profits.
See our latest analysis for Clearwater Paper
How Do I Calculate A Price To Earnings Ratio?
The formula for price to earnings is:
Price to Earnings Ratio = Price per Share ÷ Earnings per Share (EPS)
Or for Clearwater Paper:
P/E of 4.48 = $33.95 ÷ $7.58 (Based on the year to September 2018.)
Is A High P/E Ratio Good?
A higher P/E ratio means that investors are paying a higher price for each $1 of company earnings. That is not a good or a bad thing per se, but a high P/E does imply buyers are optimistic about the future.
How Growth Rates Impact P/E Ratios
Probably the most important factor in determining what P/E a company trades on is the earnings growth. When earnings grow, the ‘E’ increases, over time. That means even if the current P/E is high, it will reduce over time if the share price stays flat. A lower P/E should indicate the stock is cheap relative to others — and that may attract buyers.
Notably, Clearwater Paper grew EPS by a whopping 385% in the last year. And earnings per share have improved by 12% annually, over the last five years. So we’d generally expect it to have a relatively high P/E ratio.
How Does Clearwater Paper’s P/E Ratio Compare To Its Peers?
The P/E ratio essentially measures market expectations of a company. The image below shows that Clearwater Paper has a lower P/E than the average (9.7) P/E for companies in the forestry industry.
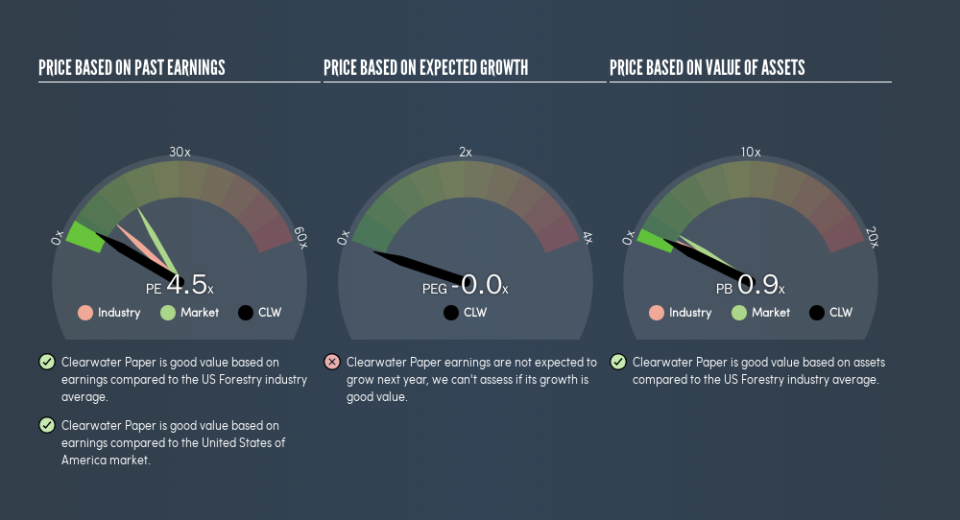
Its relatively low P/E ratio indicates that Clearwater Paper shareholders think it will struggle to do as well as other companies in its industry classification. Many investors like to buy stocks when the market is pessimistic about their prospects. You should delve deeper. I like to check if company insiders have been buying or selling.
A Limitation: P/E Ratios Ignore Debt and Cash In The Bank
Don’t forget that the P/E ratio considers market capitalization. In other words, it does not consider any debt or cash that the company may have on the balance sheet. In theory, a company can lower its future P/E ratio by using cash or debt to invest in growth.
Such spending might be good or bad, overall, but the key point here is that you need to look at debt to understand the P/E ratio in context.
How Does Clearwater Paper’s Debt Impact Its P/E Ratio?
Clearwater Paper has net debt worth a very significant 125% of its market capitalization. If you want to compare its P/E ratio to other companies, you must keep in mind that these debt levels would usually warrant a relatively low P/E.
The Bottom Line On Clearwater Paper’s P/E Ratio
Clearwater Paper has a P/E of 4.5. That’s below the average in the US market, which is 17.5. The company may have significant debt, but EPS growth was good last year. The low P/E ratio suggests current market expectations are muted, implying these levels of growth will not continue.
When the market is wrong about a stock, it gives savvy investors an opportunity. If it is underestimating a company, investors can make money by buying and holding the shares until the market corrects itself. So this free visualization of the analyst consensus on future earnings could help you make the right decision about whether to buy, sell, or hold.
Of course you might be able to find a better stock than Clearwater Paper. So you may wish to see this free collection of other companies that have grown earnings strongly.
We aim to bring you long-term focused research analysis driven by fundamental data. Note that our analysis may not factor in the latest price-sensitive company announcements or qualitative material.
If you spot an error that warrants correction, please contact the editor at editorial-team@simplywallst.com. This article by Simply Wall St is general in nature. It does not constitute a recommendation to buy or sell any stock, and does not take account of your objectives, or your financial situation. Simply Wall St has no position in the stocks mentioned. Thank you for reading.

