Read This Before You Buy Crystal International Group Limited (HKG:2232) Because Of Its P/E Ratio

This article is for investors who would like to improve their understanding of price to earnings ratios (P/E ratios). We'll apply a basic P/E ratio analysis to Crystal International Group Limited's (HKG:2232), to help you decide if the stock is worth further research. Looking at earnings over the last twelve months, Crystal International Group has a P/E ratio of 8.26. In other words, at today's prices, investors are paying HK$8.26 for every HK$1 in prior year profit.
View our latest analysis for Crystal International Group
How Do You Calculate A P/E Ratio?
The formula for P/E is:
Price to Earnings Ratio = Share Price (in reporting currency) ÷ Earnings per Share (EPS)
Or for Crystal International Group:
P/E of 8.26 = USD0.40 (Note: this is the share price in the reporting currency, namely, USD ) ÷ USD0.05 (Based on the trailing twelve months to June 2019.)
Is A High Price-to-Earnings Ratio Good?
The higher the P/E ratio, the higher the price tag of a business, relative to its trailing earnings. All else being equal, it's better to pay a low price -- but as Warren Buffett said, 'It's far better to buy a wonderful company at a fair price than a fair company at a wonderful price'.
How Does Crystal International Group's P/E Ratio Compare To Its Peers?
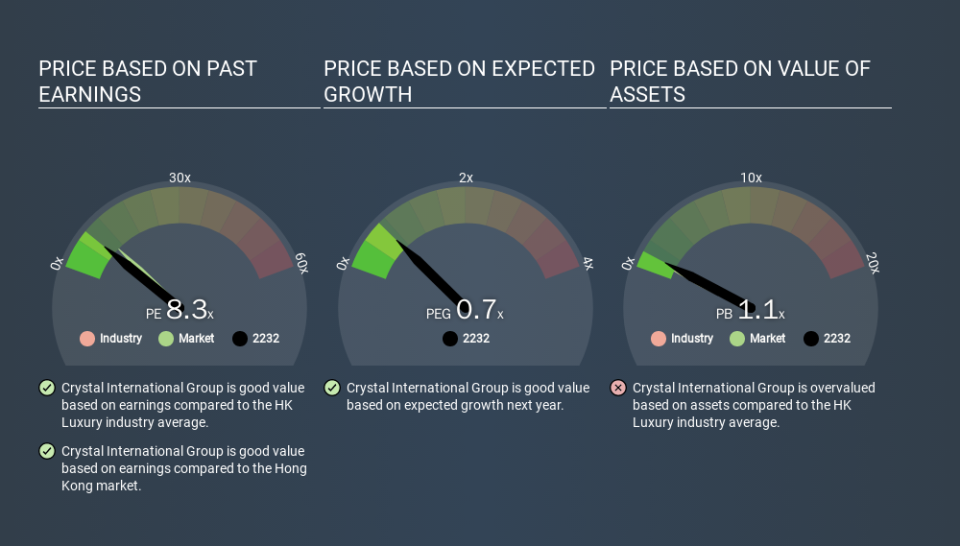
The P/E ratio essentially measures market expectations of a company. You can see in the image below that the average P/E (8.4) for companies in the luxury industry is roughly the same as Crystal International Group's P/E.
That indicates that the market expects Crystal International Group will perform roughly in line with other companies in its industry. So if Crystal International Group actually outperforms its peers going forward, that should be a positive for the share price. Checking factors such as director buying and selling. could help you form your own view on if that will happen.
How Growth Rates Impact P/E Ratios
Probably the most important factor in determining what P/E a company trades on is the earnings growth. Earnings growth means that in the future the 'E' will be higher. That means unless the share price increases, the P/E will reduce in a few years. A lower P/E should indicate the stock is cheap relative to others -- and that may attract buyers.
Crystal International Group saw earnings per share decrease by 13% last year. But it has grown its earnings per share by 6.6% per year over the last five years.
Don't Forget: The P/E Does Not Account For Debt or Bank Deposits
It's important to note that the P/E ratio considers the market capitalization, not the enterprise value. So it won't reflect the advantage of cash, or disadvantage of debt. In theory, a company can lower its future P/E ratio by using cash or debt to invest in growth.
Such spending might be good or bad, overall, but the key point here is that you need to look at debt to understand the P/E ratio in context.
How Does Crystal International Group's Debt Impact Its P/E Ratio?
Net debt totals 14% of Crystal International Group's market cap. That's enough debt to impact the P/E ratio a little; so keep it in mind if you're comparing it to companies without debt.
The Verdict On Crystal International Group's P/E Ratio
Crystal International Group trades on a P/E ratio of 8.3, which is below the HK market average of 10.4. With only modest debt, it's likely the lack of EPS growth at least partially explains the pessimism implied by the P/E ratio.
Investors have an opportunity when market expectations about a stock are wrong. As value investor Benjamin Graham famously said, 'In the short run, the market is a voting machine but in the long run, it is a weighing machine. So this free report on the analyst consensus forecasts could help you make a master move on this stock.
Of course you might be able to find a better stock than Crystal International Group. So you may wish to see this free collection of other companies that have grown earnings strongly.
If you spot an error that warrants correction, please contact the editor at editorial-team@simplywallst.com. This article by Simply Wall St is general in nature. It does not constitute a recommendation to buy or sell any stock, and does not take account of your objectives, or your financial situation. Simply Wall St has no position in the stocks mentioned.
We aim to bring you long-term focused research analysis driven by fundamental data. Note that our analysis may not factor in the latest price-sensitive company announcements or qualitative material. Thank you for reading.

