Read This Before You Buy DCB Holdings Limited (HKG:8040) Because Of Its P/E Ratio

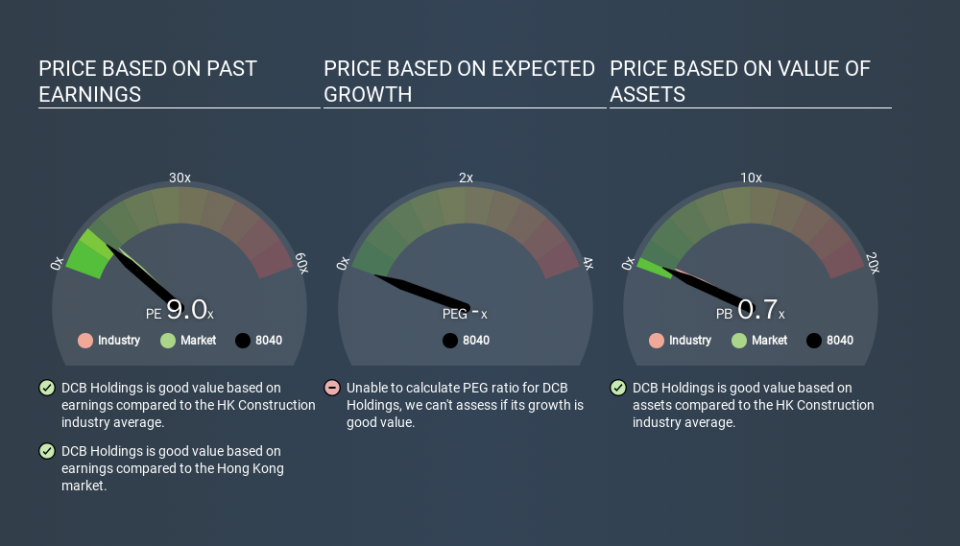
The goal of this article is to teach you how to use price to earnings ratios (P/E ratios). To keep it practical, we'll show how DCB Holdings Limited's (HKG:8040) P/E ratio could help you assess the value on offer. What is DCB Holdings's P/E ratio? Well, based on the last twelve months it is 9.03. That means that at current prices, buyers pay HK$9.03 for every HK$1 in trailing yearly profits.
See our latest analysis for DCB Holdings
How Do I Calculate A Price To Earnings Ratio?
The formula for price to earnings is:
Price to Earnings Ratio = Share Price ÷ Earnings per Share (EPS)
Or for DCB Holdings:
P/E of 9.03 = HKD0.20 ÷ HKD0.02 (Based on the year to September 2019.)
Is A High Price-to-Earnings Ratio Good?
The higher the P/E ratio, the higher the price tag of a business, relative to its trailing earnings. That isn't necessarily good or bad, but a high P/E implies relatively high expectations of what a company can achieve in the future.
Does DCB Holdings Have A Relatively High Or Low P/E For Its Industry?
The P/E ratio indicates whether the market has higher or lower expectations of a company. If you look at the image below, you can see DCB Holdings has a lower P/E than the average (10.0) in the construction industry classification.
Its relatively low P/E ratio indicates that DCB Holdings shareholders think it will struggle to do as well as other companies in its industry classification. Many investors like to buy stocks when the market is pessimistic about their prospects. If you consider the stock interesting, further research is recommended. For example, I often monitor director buying and selling.
How Growth Rates Impact P/E Ratios
If earnings fall then in the future the 'E' will be lower. Therefore, even if you pay a low multiple of earnings now, that multiple will become higher in the future. So while a stock may look cheap based on past earnings, it could be expensive based on future earnings.
DCB Holdings shrunk earnings per share by 58% over the last year. And EPS is down 17% a year, over the last 5 years. This could justify a pessimistic P/E.
Don't Forget: The P/E Does Not Account For Debt or Bank Deposits
It's important to note that the P/E ratio considers the market capitalization, not the enterprise value. So it won't reflect the advantage of cash, or disadvantage of debt. In theory, a company can lower its future P/E ratio by using cash or debt to invest in growth.
Such spending might be good or bad, overall, but the key point here is that you need to look at debt to understand the P/E ratio in context.
So What Does DCB Holdings's Balance Sheet Tell Us?
Net debt totals just 4.7% of DCB Holdings's market cap. The market might award it a higher P/E ratio if it had net cash, but its unlikely this low level of net borrowing is having a big impact on the P/E multiple.
The Verdict On DCB Holdings's P/E Ratio
DCB Holdings has a P/E of 9.0. That's below the average in the HK market, which is 10.6. With only modest debt, it's likely the lack of EPS growth at least partially explains the pessimism implied by the P/E ratio.
Investors have an opportunity when market expectations about a stock are wrong. As value investor Benjamin Graham famously said, 'In the short run, the market is a voting machine but in the long run, it is a weighing machine. We don't have analyst forecasts, but shareholders might want to examine this detailed historical graph of earnings, revenue and cash flow.
You might be able to find a better buy than DCB Holdings. If you want a selection of possible winners, check out this free list of interesting companies that trade on a P/E below 20 (but have proven they can grow earnings).
If you spot an error that warrants correction, please contact the editor at editorial-team@simplywallst.com. This article by Simply Wall St is general in nature. It does not constitute a recommendation to buy or sell any stock, and does not take account of your objectives, or your financial situation. Simply Wall St has no position in the stocks mentioned.
We aim to bring you long-term focused research analysis driven by fundamental data. Note that our analysis may not factor in the latest price-sensitive company announcements or qualitative material. Thank you for reading.
