Read This Before You Buy Feintool International Holding AG (VTX:FTON) Because Of Its P/E Ratio

The goal of this article is to teach you how to use price to earnings ratios (P/E ratios). We'll show how you can use Feintool International Holding AG's (VTX:FTON) P/E ratio to inform your assessment of the investment opportunity. What is Feintool International Holding's P/E ratio? Well, based on the last twelve months it is 10.01. That is equivalent to an earnings yield of about 10.0%.
Want to participate in a short research study? Help shape the future of investing tools and you could win a $250 gift card!
Check out our latest analysis for Feintool International Holding
How Do I Calculate A Price To Earnings Ratio?
The formula for price to earnings is:
Price to Earnings Ratio = Price per Share ÷ Earnings per Share (EPS)
Or for Feintool International Holding:
P/E of 10.01 = CHF66.4 ÷ CHF6.63 (Based on the year to December 2018.)
Is A High Price-to-Earnings Ratio Good?
The higher the P/E ratio, the higher the price tag of a business, relative to its trailing earnings. All else being equal, it's better to pay a low price -- but as Warren Buffett said, 'It's far better to buy a wonderful company at a fair price than a fair company at a wonderful price.'
How Growth Rates Impact P/E Ratios
Earnings growth rates have a big influence on P/E ratios. When earnings grow, the 'E' increases, over time. Therefore, even if you pay a high multiple of earnings now, that multiple will become lower in the future. And as that P/E ratio drops, the company will look cheap, unless its share price increases.
Feintool International Holding's earnings per share grew by -6.6% in the last twelve months. And its annual EPS growth rate over 5 years is 13%.
How Does Feintool International Holding's P/E Ratio Compare To Its Peers?
The P/E ratio essentially measures market expectations of a company. The image below shows that Feintool International Holding has a lower P/E than the average (18.8) P/E for companies in the machinery industry.
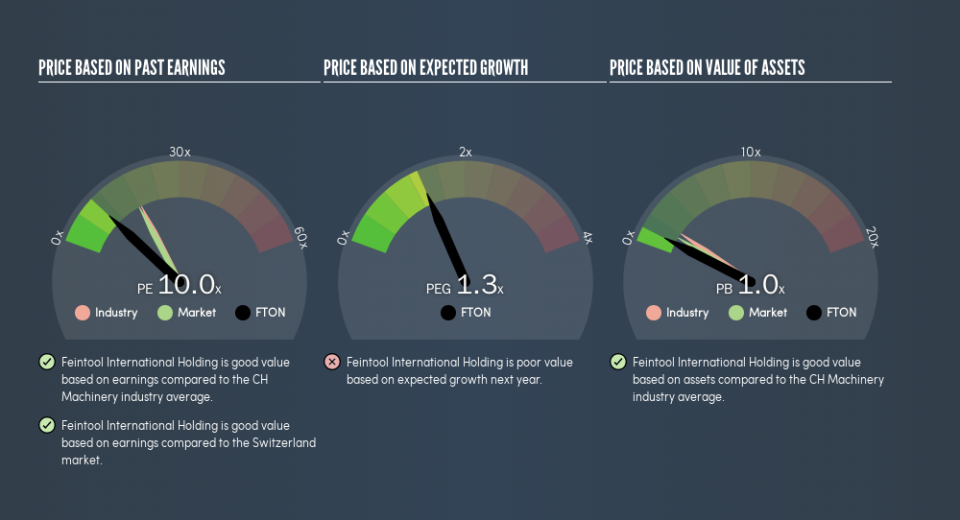
This suggests that market participants think Feintool International Holding will underperform other companies in its industry. Many investors like to buy stocks when the market is pessimistic about their prospects. You should delve deeper. I like to check if company insiders have been buying or selling.
Remember: P/E Ratios Don't Consider The Balance Sheet
One drawback of using a P/E ratio is that it considers market capitalization, but not the balance sheet. Thus, the metric does not reflect cash or debt held by the company. Theoretically, a business can improve its earnings (and produce a lower P/E in the future) by investing in growth. That means taking on debt (or spending its cash).
While growth expenditure doesn't always pay off, the point is that it is a good option to have; but one that the P/E ratio ignores.
Feintool International Holding's Balance Sheet
Net debt is 47% of Feintool International Holding's market cap. While that's enough to warrant consideration, it doesn't really concern us.
The Verdict On Feintool International Holding's P/E Ratio
Feintool International Holding has a P/E of 10. That's below the average in the CH market, which is 18. The company does have a little debt, and EPS is moving in the right direction. If you believe growth will continue - or even increase - then the low P/E may signify opportunity.
Investors should be looking to buy stocks that the market is wrong about. If it is underestimating a company, investors can make money by buying and holding the shares until the market corrects itself. So this free visualization of the analyst consensus on future earnings could help you make the right decision about whether to buy, sell, or hold.
But note: Feintool International Holding may not be the best stock to buy. So take a peek at this free list of interesting companies with strong recent earnings growth (and a P/E ratio below 20).
We aim to bring you long-term focused research analysis driven by fundamental data. Note that our analysis may not factor in the latest price-sensitive company announcements or qualitative material.
If you spot an error that warrants correction, please contact the editor at editorial-team@simplywallst.com. This article by Simply Wall St is general in nature. It does not constitute a recommendation to buy or sell any stock, and does not take account of your objectives, or your financial situation. Simply Wall St has no position in the stocks mentioned. Thank you for reading.

