Read This Before You Buy Hostelworld Group Plc (LON:HSW) Because Of Its P/E Ratio

Want to participate in a short research study? Help shape the future of investing tools and you could win a $250 gift card!
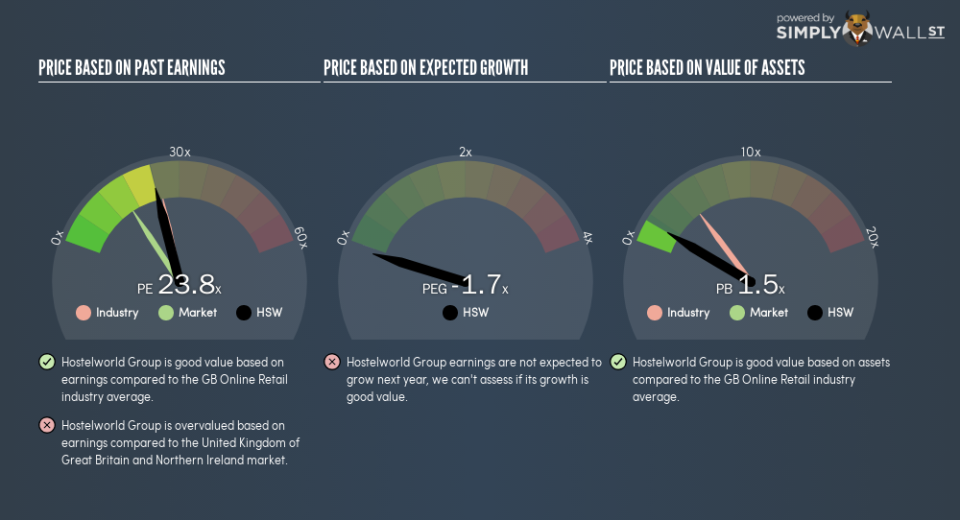
This article is for investors who would like to improve their understanding of price to earnings ratios (P/E ratios). We’ll look at Hostelworld Group Plc’s (LON:HSW) P/E ratio and reflect on what it tells us about the company’s share price. Hostelworld Group has a P/E ratio of 23.85, based on the last twelve months. That is equivalent to an earnings yield of about 4.2%.
Check out our latest analysis for Hostelworld Group
How Do You Calculate A P/E Ratio?
The formula for P/E is:
Price to Earnings Ratio = Price per Share (in the reporting currency) ÷ Earnings per Share (EPS)
Or for Hostelworld Group:
P/E of 23.85 = €2.22 (Note: this is the share price in the reporting currency, namely, EUR ) ÷ €0.093 (Based on the year to June 2018.)
Is A High Price-to-Earnings Ratio Good?
A higher P/E ratio means that investors are paying a higher price for each £1 of company earnings. That is not a good or a bad thing per se, but a high P/E does imply buyers are optimistic about the future.
How Growth Rates Impact P/E Ratios
P/E ratios primarily reflect market expectations around earnings growth rates. When earnings grow, the ‘E’ increases, over time. That means unless the share price increases, the P/E will reduce in a few years. A lower P/E should indicate the stock is cheap relative to others — and that may attract buyers.
Hostelworld Group shrunk earnings per share by 10.0% last year. But over the longer term (5 years) earnings per share have increased by 86%.
How Does Hostelworld Group’s P/E Ratio Compare To Its Peers?
We can get an indication of market expectations by looking at the P/E ratio. You can see in the image below that the average P/E (25) for companies in the online retail industry is roughly the same as Hostelworld Group’s P/E.
Its P/E ratio suggests that Hostelworld Group shareholders think that in the future it will perform about the same as other companies in its industry classification. If the company has better than average prospects, then the market might be underestimating it. Checking factors such as the tenure of the board and management could help you form your own view on if that will happen.
Don’t Forget: The P/E Does Not Account For Debt or Bank Deposits
It’s important to note that the P/E ratio considers the market capitalization, not the enterprise value. That means it doesn’t take debt or cash into account. Theoretically, a business can improve its earnings (and produce a lower P/E in the future), by taking on debt (or spending its remaining cash).
Such expenditure might be good or bad, in the long term, but the point here is that the balance sheet is not reflected by this ratio.
Is Debt Impacting Hostelworld Group’s P/E?
Hostelworld Group has net cash of €23m. That should lead to a higher P/E than if it did have debt, because its strong balance sheets gives it more options.
The Verdict On Hostelworld Group’s P/E Ratio
Hostelworld Group trades on a P/E ratio of 23.8, which is above the GB market average of 15.8. The recent drop in earnings per share might keep value investors away, but the net cash position means the company has time to improve: and the high P/E suggests the market thinks it will.
Investors should be looking to buy stocks that the market is wrong about. People often underestimate remarkable growth — so investors can make money when fast growth is not fully appreciated. So this free visual report on analyst forecasts could hold they key to an excellent investment decision.
But note: Hostelworld Group may not be the best stock to buy. So take a peek at this free list of interesting companies with strong recent earnings growth (and a P/E ratio below 20).
To help readers see past the short term volatility of the financial market, we aim to bring you a long-term focused research analysis purely driven by fundamental data. Note that our analysis does not factor in the latest price-sensitive company announcements.
The author is an independent contributor and at the time of publication had no position in the stocks mentioned. For errors that warrant correction please contact the editor at editorial-team@simplywallst.com.

