Read This Before You Buy ICICI Prudential Life Insurance Company Limited (NSE:ICICIPRULI) Because Of Its P/E Ratio

The goal of this article is to teach you how to use price to earnings ratios (P/E ratios). We'll look at ICICI Prudential Life Insurance Company Limited's (NSE:ICICIPRULI) P/E ratio and reflect on what it tells us about the company's share price. Based on the last twelve months, ICICI Prudential Life Insurance's P/E ratio is 42.83. That means that at current prices, buyers pay ₹42.83 for every ₹1 in trailing yearly profits.
Check out our latest analysis for ICICI Prudential Life Insurance
How Do I Calculate ICICI Prudential Life Insurance's Price To Earnings Ratio?
The formula for P/E is:
Price to Earnings Ratio = Price per Share ÷ Earnings per Share (EPS)
Or for ICICI Prudential Life Insurance:
P/E of 42.83 = ₹387.25 ÷ ₹9.04 (Based on the trailing twelve months to June 2019.)
Is A High P/E Ratio Good?
The higher the P/E ratio, the higher the price tag of a business, relative to its trailing earnings. All else being equal, it's better to pay a low price -- but as Warren Buffett said, 'It's far better to buy a wonderful company at a fair price than a fair company at a wonderful price.'
Does ICICI Prudential Life Insurance Have A Relatively High Or Low P/E For Its Industry?
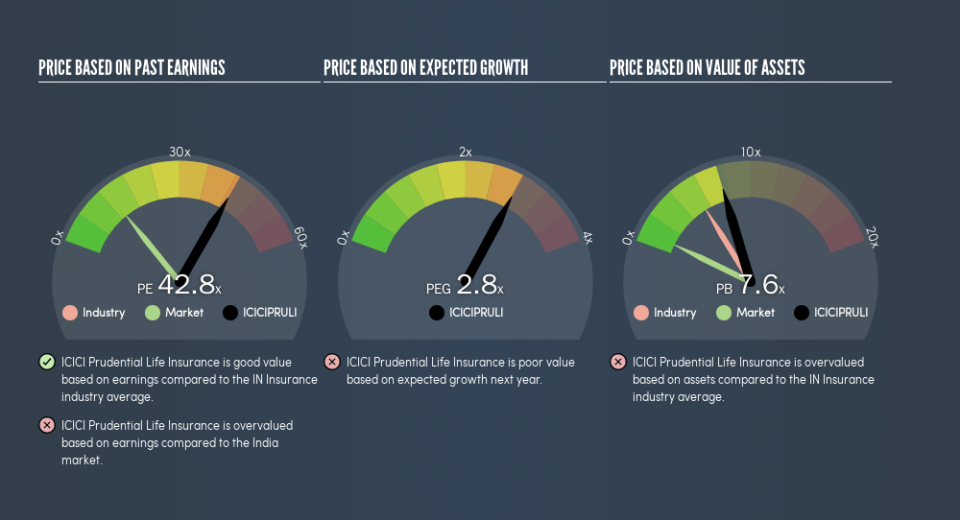
The P/E ratio indicates whether the market has higher or lower expectations of a company. The image below shows that ICICI Prudential Life Insurance has a P/E ratio that is roughly in line with the insurance industry average (42.8).
ICICI Prudential Life Insurance's P/E tells us that market participants think its prospects are roughly in line with its industry. If the company has better than average prospects, then the market might be underestimating it. Checking factors such as director buying and selling. could help you form your own view on if that will happen.
How Growth Rates Impact P/E Ratios
When earnings fall, the 'E' decreases, over time. That means even if the current P/E is low, it will increase over time if the share price stays flat. So while a stock may look cheap based on past earnings, it could be expensive based on future earnings.
ICICI Prudential Life Insurance saw earnings per share decrease by 27% last year. And over the longer term (5 years) earnings per share have decreased 4.0% annually. This could justify a pessimistic P/E.
A Limitation: P/E Ratios Ignore Debt and Cash In The Bank
One drawback of using a P/E ratio is that it considers market capitalization, but not the balance sheet. That means it doesn't take debt or cash into account. The exact same company would hypothetically deserve a higher P/E ratio if it had a strong balance sheet, than if it had a weak one with lots of debt, because a cashed up company can spend on growth.
Such spending might be good or bad, overall, but the key point here is that you need to look at debt to understand the P/E ratio in context.
So What Does ICICI Prudential Life Insurance's Balance Sheet Tell Us?
The extra options and safety that comes with ICICI Prudential Life Insurance's ₹978m net cash position means that it deserves a higher P/E than it would if it had a lot of net debt.
The Bottom Line On ICICI Prudential Life Insurance's P/E Ratio
ICICI Prudential Life Insurance has a P/E of 42.8. That's significantly higher than the average in its market, which is 13.3. Falling earnings per share is probably keeping traditional value investors away, but the net cash position means the company has time to improve: and the high P/E suggests the market thinks it will.
Investors have an opportunity when market expectations about a stock are wrong. If the reality for a company is better than it expects, you can make money by buying and holding for the long term. So this free visual report on analyst forecasts could hold the key to an excellent investment decision.
But note: ICICI Prudential Life Insurance may not be the best stock to buy. So take a peek at this free list of interesting companies with strong recent earnings growth (and a P/E ratio below 20).
We aim to bring you long-term focused research analysis driven by fundamental data. Note that our analysis may not factor in the latest price-sensitive company announcements or qualitative material.
If you spot an error that warrants correction, please contact the editor at editorial-team@simplywallst.com. This article by Simply Wall St is general in nature. It does not constitute a recommendation to buy or sell any stock, and does not take account of your objectives, or your financial situation. Simply Wall St has no position in the stocks mentioned. Thank you for reading.
