Read This Before You Buy Neodecortech S.p.A. (BIT:NDT) Because Of Its P/E Ratio

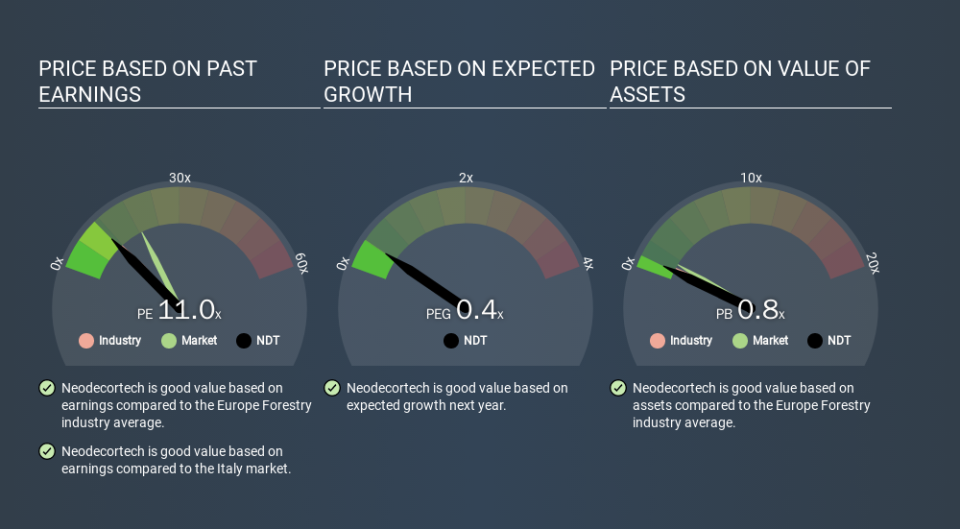
This article is written for those who want to get better at using price to earnings ratios (P/E ratios). To keep it practical, we'll show how Neodecortech S.p.A.'s (BIT:NDT) P/E ratio could help you assess the value on offer. Neodecortech has a P/E ratio of 10.96, based on the last twelve months. In other words, at today's prices, investors are paying €10.96 for every €1 in prior year profit.
See our latest analysis for Neodecortech
How Do I Calculate A Price To Earnings Ratio?
The formula for price to earnings is:
Price to Earnings Ratio = Price per Share ÷ Earnings per Share (EPS)
Or for Neodecortech:
P/E of 10.96 = EUR3.70 ÷ EUR0.34 (Based on the trailing twelve months to June 2019.)
Is A High Price-to-Earnings Ratio Good?
A higher P/E ratio means that buyers have to pay a higher price for each EUR1 the company has earned over the last year. All else being equal, it's better to pay a low price -- but as Warren Buffett said, 'It's far better to buy a wonderful company at a fair price than a fair company at a wonderful price'.
How Does Neodecortech's P/E Ratio Compare To Its Peers?
The P/E ratio indicates whether the market has higher or lower expectations of a company. As you can see below Neodecortech has a P/E ratio that is fairly close for the average for the forestry industry, which is 11.7.
That indicates that the market expects Neodecortech will perform roughly in line with other companies in its industry. The company could surprise by performing better than average, in the future. Further research into factors such as insider buying and selling, could help you form your own view on whether that is likely.
How Growth Rates Impact P/E Ratios
Earnings growth rates have a big influence on P/E ratios. That's because companies that grow earnings per share quickly will rapidly increase the 'E' in the equation. That means even if the current P/E is high, it will reduce over time if the share price stays flat. So while a stock may look expensive based on past earnings, it could be cheap based on future earnings.
Neodecortech increased earnings per share by an impressive 13% over the last twelve months.
Remember: P/E Ratios Don't Consider The Balance Sheet
It's important to note that the P/E ratio considers the market capitalization, not the enterprise value. So it won't reflect the advantage of cash, or disadvantage of debt. Hypothetically, a company could reduce its future P/E ratio by spending its cash (or taking on debt) to achieve higher earnings.
Such spending might be good or bad, overall, but the key point here is that you need to look at debt to understand the P/E ratio in context.
So What Does Neodecortech's Balance Sheet Tell Us?
Net debt totals 87% of Neodecortech's market cap. This is enough debt that you'd have to make some adjustments before using the P/E ratio to compare it to a company with net cash.
The Bottom Line On Neodecortech's P/E Ratio
Neodecortech's P/E is 11.0 which is below average (18.7) in the IT market. The company has a meaningful amount of debt on the balance sheet, but that should not eclipse the solid earnings growth. If it continues to grow, then the current low P/E may prove to be unjustified.
Investors have an opportunity when market expectations about a stock are wrong. If it is underestimating a company, investors can make money by buying and holding the shares until the market corrects itself. So this free visualization of the analyst consensus on future earnings could help you make the right decision about whether to buy, sell, or hold.
You might be able to find a better buy than Neodecortech. If you want a selection of possible winners, check out this free list of interesting companies that trade on a P/E below 20 (but have proven they can grow earnings).
If you spot an error that warrants correction, please contact the editor at editorial-team@simplywallst.com. This article by Simply Wall St is general in nature. It does not constitute a recommendation to buy or sell any stock, and does not take account of your objectives, or your financial situation. Simply Wall St has no position in the stocks mentioned.
We aim to bring you long-term focused research analysis driven by fundamental data. Note that our analysis may not factor in the latest price-sensitive company announcements or qualitative material. Thank you for reading.
