Read This Before You Buy Softronic AB (STO:SOF B) Because Of Its P/E Ratio

Want to participate in a short research study? Help shape the future of investing tools and you could win a $250 gift card!
The goal of this article is to teach you how to use price to earnings ratios (P/E ratios). We'll apply a basic P/E ratio analysis to Softronic AB's (STO:SOF B), to help you decide if the stock is worth further research. Looking at earnings over the last twelve months, Softronic has a P/E ratio of 15.83. That is equivalent to an earnings yield of about 6.3%.
See our latest analysis for Softronic
How Do You Calculate A P/E Ratio?
The formula for price to earnings is:
Price to Earnings Ratio = Share Price ÷ Earnings per Share (EPS)
Or for Softronic:
P/E of 15.83 = SEK15.56 ÷ SEK0.98 (Based on the year to March 2019.)
Is A High Price-to-Earnings Ratio Good?
A higher P/E ratio means that buyers have to pay a higher price for each SEK1 the company has earned over the last year. That isn't a good or a bad thing on its own, but a high P/E means that buyers have a higher opinion of the business's prospects, relative to stocks with a lower P/E.
How Growth Rates Impact P/E Ratios
P/E ratios primarily reflect market expectations around earnings growth rates. That's because companies that grow earnings per share quickly will rapidly increase the 'E' in the equation. And in that case, the P/E ratio itself will drop rather quickly. And as that P/E ratio drops, the company will look cheap, unless its share price increases.
Softronic's earnings per share fell by 8.1% in the last twelve months. But it has grown its earnings per share by 12% per year over the last five years.
How Does Softronic's P/E Ratio Compare To Its Peers?
One good way to get a quick read on what market participants expect of a company is to look at its P/E ratio. You can see in the image below that the average P/E (17.1) for companies in the it industry is roughly the same as Softronic's P/E.
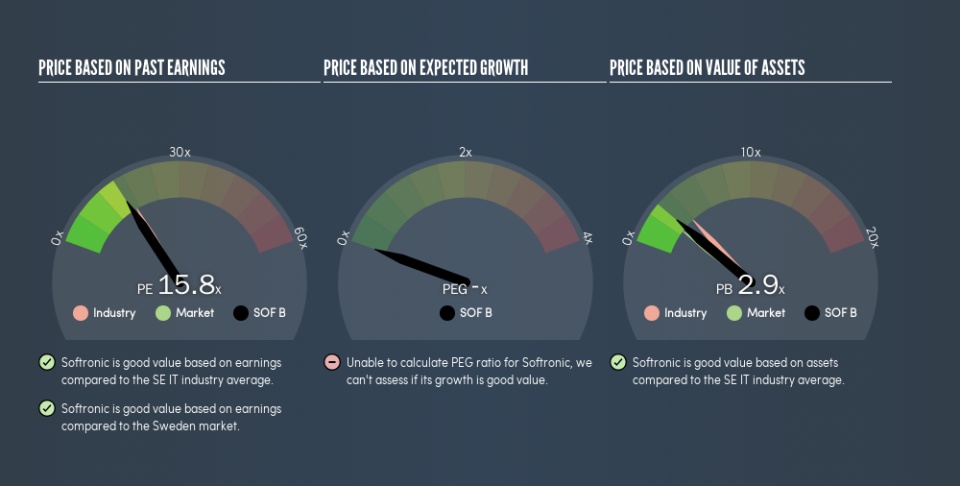
Softronic's P/E tells us that market participants think its prospects are roughly in line with its industry. The company could surprise by performing better than average, in the future. I inform my view byby checking management tenure and remuneration, among other things.
Remember: P/E Ratios Don't Consider The Balance Sheet
The 'Price' in P/E reflects the market capitalization of the company. In other words, it does not consider any debt or cash that the company may have on the balance sheet. In theory, a company can lower its future P/E ratio by using cash or debt to invest in growth.
Such spending might be good or bad, overall, but the key point here is that you need to look at debt to understand the P/E ratio in context.
So What Does Softronic's Balance Sheet Tell Us?
The extra options and safety that comes with Softronic's kr81m net cash position means that it deserves a higher P/E than it would if it had a lot of net debt.
The Bottom Line On Softronic's P/E Ratio
Softronic trades on a P/E ratio of 15.8, which is fairly close to the SE market average of 16.2. While the lack of recent growth is probably muting optimism, the net cash position means it's not surprising that expectations put the company roughly in line with the market average P/E.
When the market is wrong about a stock, it gives savvy investors an opportunity. If it is underestimating a company, investors can make money by buying and holding the shares until the market corrects itself. We don't have analyst forecasts, but you might want to assess this data-rich visualization of earnings, revenue and cash flow.
Of course you might be able to find a better stock than Softronic. So you may wish to see this free collection of other companies that have grown earnings strongly.
We aim to bring you long-term focused research analysis driven by fundamental data. Note that our analysis may not factor in the latest price-sensitive company announcements or qualitative material.
If you spot an error that warrants correction, please contact the editor at editorial-team@simplywallst.com. This article by Simply Wall St is general in nature. It does not constitute a recommendation to buy or sell any stock, and does not take account of your objectives, or your financial situation. Simply Wall St has no position in the stocks mentioned. Thank you for reading.
