Read This Before You Buy Texhong Textile Group Limited (HKG:2678) Because Of Its P/E Ratio

The goal of this article is to teach you how to use price to earnings ratios (P/E ratios). To keep it practical, we’ll show how Texhong Textile Group Limited’s (HKG:2678) P/E ratio could help you assess the value on offer. Based on the last twelve months, Texhong Textile Group’s P/E ratio is 8.05. That is equivalent to an earnings yield of about 12%.
View our latest analysis for Texhong Textile Group
Want to participate in a research study? Help shape the future of investing tools and earn a $60 gift card!
How Do I Calculate Texhong Textile Group’s Price To Earnings Ratio?
The formula for price to earnings is:
Price to Earnings Ratio = Price per Share (in the reporting currency) ÷ Earnings per Share (EPS)
Or for Texhong Textile Group:
P/E of 8.05 = CN¥10.24 (Note: this is the share price in the reporting currency, namely, CNY ) ÷ CN¥1.27 (Based on the trailing twelve months to December 2018.)
Is A High P/E Ratio Good?
A higher P/E ratio means that investors are paying a higher price for each HK$1 of company earnings. That is not a good or a bad thing per se, but a high P/E does imply buyers are optimistic about the future.
How Growth Rates Impact P/E Ratios
Earnings growth rates have a big influence on P/E ratios. That’s because companies that grow earnings per share quickly will rapidly increase the ‘E’ in the equation. That means unless the share price increases, the P/E will reduce in a few years. So while a stock may look expensive based on past earnings, it could be cheap based on future earnings.
Texhong Textile Group maintained roughly steady earnings over the last twelve months. But EPS is up 14% over the last 5 years.
How Does Texhong Textile Group’s P/E Ratio Compare To Its Peers?
We can get an indication of market expectations by looking at the P/E ratio. The image below shows that Texhong Textile Group has a lower P/E than the average (11.2) P/E for companies in the luxury industry.
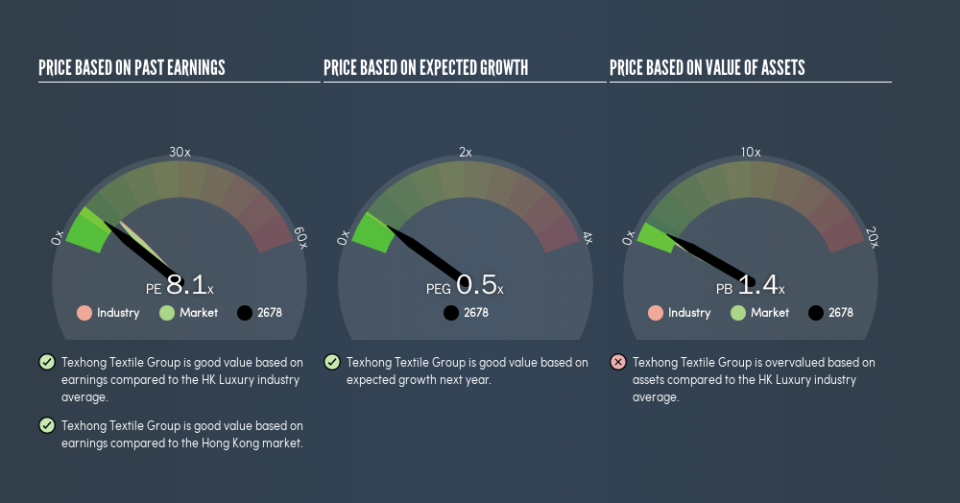
This suggests that market participants think Texhong Textile Group will underperform other companies in its industry. Many investors like to buy stocks when the market is pessimistic about their prospects. If you consider the stock interesting, further research is recommended. For example, I often monitor director buying and selling.
Remember: P/E Ratios Don’t Consider The Balance Sheet
The ‘Price’ in P/E reflects the market capitalization of the company. In other words, it does not consider any debt or cash that the company may have on the balance sheet. Theoretically, a business can improve its earnings (and produce a lower P/E in the future), by taking on debt (or spending its remaining cash).
Spending on growth might be good or bad a few years later, but the point is that the P/E ratio does not account for the option (or lack thereof).
How Does Texhong Textile Group’s Debt Impact Its P/E Ratio?
Texhong Textile Group has net debt worth 65% of its market capitalization. If you want to compare its P/E ratio to other companies, you should absolutely keep in mind it has significant borrowings.
The Verdict On Texhong Textile Group’s P/E Ratio
Texhong Textile Group has a P/E of 8.1. That’s below the average in the HK market, which is 10.8. It’s good to see EPS growth in the last 12 months, but the debt on the balance sheet might be muting expectations.
Investors have an opportunity when market expectations about a stock are wrong. If it is underestimating a company, investors can make money by buying and holding the shares until the market corrects itself. So this free visualization of the analyst consensus on future earnings could help you make the right decision about whether to buy, sell, or hold.
But note: Texhong Textile Group may not be the best stock to buy. So take a peek at this free list of interesting companies with strong recent earnings growth (and a P/E ratio below 20).
We aim to bring you long-term focused research analysis driven by fundamental data. Note that our analysis may not factor in the latest price-sensitive company announcements or qualitative material.
If you spot an error that warrants correction, please contact the editor at editorial-team@simplywallst.com. This article by Simply Wall St is general in nature. It does not constitute a recommendation to buy or sell any stock, and does not take account of your objectives, or your financial situation. Simply Wall St has no position in the stocks mentioned. Thank you for reading.

