Read This Before You Buy Yestar Healthcare Holdings Company Limited (HKG:2393) Because Of Its P/E Ratio

This article is for investors who would like to improve their understanding of price to earnings ratios (P/E ratios). We'll show how you can use Yestar Healthcare Holdings Company Limited's (HKG:2393) P/E ratio to inform your assessment of the investment opportunity. Yestar Healthcare Holdings has a P/E ratio of 10.55, based on the last twelve months. That corresponds to an earnings yield of approximately 9.5%.
Check out our latest analysis for Yestar Healthcare Holdings
How Do You Calculate A P/E Ratio?
The formula for P/E is:
Price to Earnings Ratio = Share Price (in reporting currency) ÷ Earnings per Share (EPS)
Or for Yestar Healthcare Holdings:
P/E of 10.55 = CN¥1.27 (Note: this is the share price in the reporting currency, namely, CNY ) ÷ CN¥0.12 (Based on the trailing twelve months to June 2019.)
Is A High P/E Ratio Good?
A higher P/E ratio means that investors are paying a higher price for each HK$1 of company earnings. That isn't a good or a bad thing on its own, but a high P/E means that buyers have a higher opinion of the business's prospects, relative to stocks with a lower P/E.
How Does Yestar Healthcare Holdings's P/E Ratio Compare To Its Peers?
One good way to get a quick read on what market participants expect of a company is to look at its P/E ratio. The image below shows that Yestar Healthcare Holdings has a lower P/E than the average (14.7) P/E for companies in the medical equipment industry.
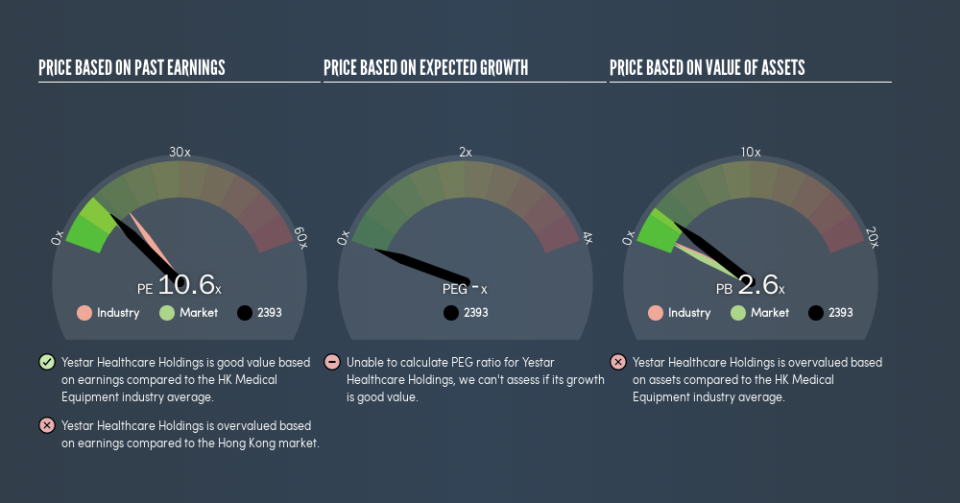
Yestar Healthcare Holdings's P/E tells us that market participants think it will not fare as well as its peers in the same industry. While current expectations are low, the stock could be undervalued if the situation is better than the market assumes. You should delve deeper. I like to check if company insiders have been buying or selling.
How Growth Rates Impact P/E Ratios
P/E ratios primarily reflect market expectations around earnings growth rates. If earnings are growing quickly, then the 'E' in the equation will increase faster than it would otherwise. That means even if the current P/E is high, it will reduce over time if the share price stays flat. So while a stock may look expensive based on past earnings, it could be cheap based on future earnings.
Yestar Healthcare Holdings maintained roughly steady earnings over the last twelve months. But it has grown its earnings per share by 23% per year over the last five years.
Remember: P/E Ratios Don't Consider The Balance Sheet
One drawback of using a P/E ratio is that it considers market capitalization, but not the balance sheet. So it won't reflect the advantage of cash, or disadvantage of debt. Hypothetically, a company could reduce its future P/E ratio by spending its cash (or taking on debt) to achieve higher earnings.
Such expenditure might be good or bad, in the long term, but the point here is that the balance sheet is not reflected by this ratio.
Yestar Healthcare Holdings's Balance Sheet
Net debt is 39% of Yestar Healthcare Holdings's market cap. You'd want to be aware of this fact, but it doesn't bother us.
The Bottom Line On Yestar Healthcare Holdings's P/E Ratio
Yestar Healthcare Holdings trades on a P/E ratio of 10.6, which is above its market average of 9.8. With some debt but no EPS growth last year, the market has high expectations of future profits.
Investors should be looking to buy stocks that the market is wrong about. As value investor Benjamin Graham famously said, 'In the short run, the market is a voting machine but in the long run, it is a weighing machine.' So this free report on the analyst consensus forecasts could help you make a master move on this stock.
Of course you might be able to find a better stock than Yestar Healthcare Holdings. So you may wish to see this free collection of other companies that have grown earnings strongly.
We aim to bring you long-term focused research analysis driven by fundamental data. Note that our analysis may not factor in the latest price-sensitive company announcements or qualitative material.
If you spot an error that warrants correction, please contact the editor at editorial-team@simplywallst.com. This article by Simply Wall St is general in nature. It does not constitute a recommendation to buy or sell any stock, and does not take account of your objectives, or your financial situation. Simply Wall St has no position in the stocks mentioned. Thank you for reading.

