Rejlers AB (publ)’s (STO:REJL B) Investment Returns Are Lagging Its Industry

Today we are going to look at Rejlers AB (publ) (STO:REJL B) to see whether it might be an attractive investment prospect. To be precise, we'll consider its Return On Capital Employed (ROCE), as that will inform our view of the quality of the business.
First, we'll go over how we calculate ROCE. Second, we'll look at its ROCE compared to similar companies. Finally, we'll look at how its current liabilities affect its ROCE.
What is Return On Capital Employed (ROCE)?
ROCE measures the 'return' (pre-tax profit) a company generates from capital employed in its business. Generally speaking a higher ROCE is better. In brief, it is a useful tool, but it is not without drawbacks. Author Edwin Whiting says to be careful when comparing the ROCE of different businesses, since 'No two businesses are exactly alike.'
How Do You Calculate Return On Capital Employed?
Analysts use this formula to calculate return on capital employed:
Return on Capital Employed = Earnings Before Interest and Tax (EBIT) ÷ (Total Assets - Current Liabilities)
Or for Rejlers:
0.11 = kr123m ÷ (kr1.7b - kr595m) (Based on the trailing twelve months to June 2019.)
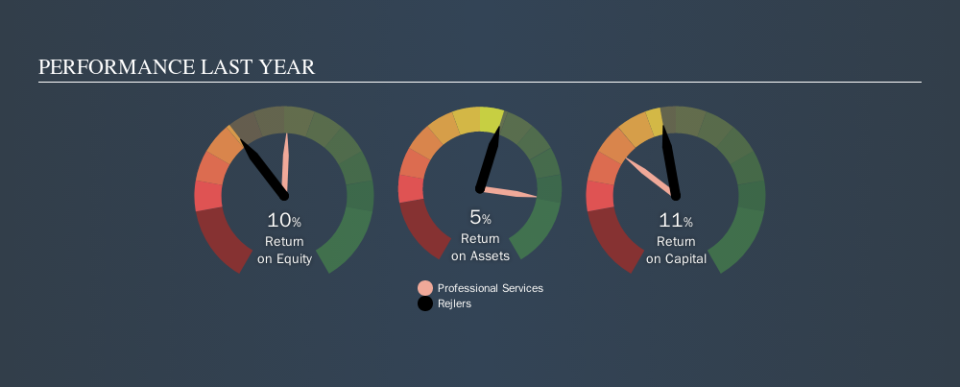
So, Rejlers has an ROCE of 11%.
See our latest analysis for Rejlers
Does Rejlers Have A Good ROCE?
When making comparisons between similar businesses, investors may find ROCE useful. In this analysis, Rejlers's ROCE appears meaningfully below the 16% average reported by the Professional Services industry. This performance is not ideal, as it suggests the company may not be deploying its capital as effectively as some competitors. Independently of how Rejlers compares to its industry, its ROCE in absolute terms appears decent, and the company may be worthy of closer investigation.
We can see that , Rejlers currently has an ROCE of 11% compared to its ROCE 3 years ago, which was 5.7%. This makes us think the business might be improving. You can see in the image below how Rejlers's ROCE compares to its industry. Click to see more on past growth.
When considering this metric, keep in mind that it is backwards looking, and not necessarily predictive. Companies in cyclical industries can be difficult to understand using ROCE, as returns typically look high during boom times, and low during busts. ROCE is only a point-in-time measure. What happens in the future is pretty important for investors, so we have prepared a free report on analyst forecasts for Rejlers.
Do Rejlers's Current Liabilities Skew Its ROCE?
Current liabilities include invoices, such as supplier payments, short-term debt, or a tax bill, that need to be paid within 12 months. Due to the way ROCE is calculated, a high level of current liabilities makes a company look as though it has less capital employed, and thus can (sometimes unfairly) boost the ROCE. To counter this, investors can check if a company has high current liabilities relative to total assets.
Rejlers has total liabilities of kr595m and total assets of kr1.7b. Therefore its current liabilities are equivalent to approximately 34% of its total assets. With this level of current liabilities, Rejlers's ROCE is boosted somewhat.
What We Can Learn From Rejlers's ROCE
With a decent ROCE, the company could be interesting, but remember that the level of current liabilities make the ROCE look better. There might be better investments than Rejlers out there, but you will have to work hard to find them . These promising businesses with rapidly growing earnings might be right up your alley.
If you are like me, then you will not want to miss this free list of growing companies that insiders are buying.
We aim to bring you long-term focused research analysis driven by fundamental data. Note that our analysis may not factor in the latest price-sensitive company announcements or qualitative material.
If you spot an error that warrants correction, please contact the editor at editorial-team@simplywallst.com. This article by Simply Wall St is general in nature. It does not constitute a recommendation to buy or sell any stock, and does not take account of your objectives, or your financial situation. Simply Wall St has no position in the stocks mentioned. Thank you for reading.
