Is Reliance Communications (NSE:RCOM) Using Debt In A Risky Way?

Howard Marks put it nicely when he said that, rather than worrying about share price volatility, 'The possibility of permanent loss is the risk I worry about... and every practical investor I know worries about.' When we think about how risky a company is, we always like to look at its use of debt, since debt overload can lead to ruin. We can see that Reliance Communications Limited (NSE:RCOM) does use debt in its business. But should shareholders be worried about its use of debt?
When Is Debt Dangerous?
Debt and other liabilities become risky for a business when it cannot easily fulfill those obligations, either with free cash flow or by raising capital at an attractive price. Part and parcel of capitalism is the process of 'creative destruction' where failed businesses are mercilessly liquidated by their bankers. However, a more usual (but still expensive) situation is where a company must dilute shareholders at a cheap share price simply to get debt under control. By replacing dilution, though, debt can be an extremely good tool for businesses that need capital to invest in growth at high rates of return. When we examine debt levels, we first consider both cash and debt levels, together.
View our latest analysis for Reliance Communications
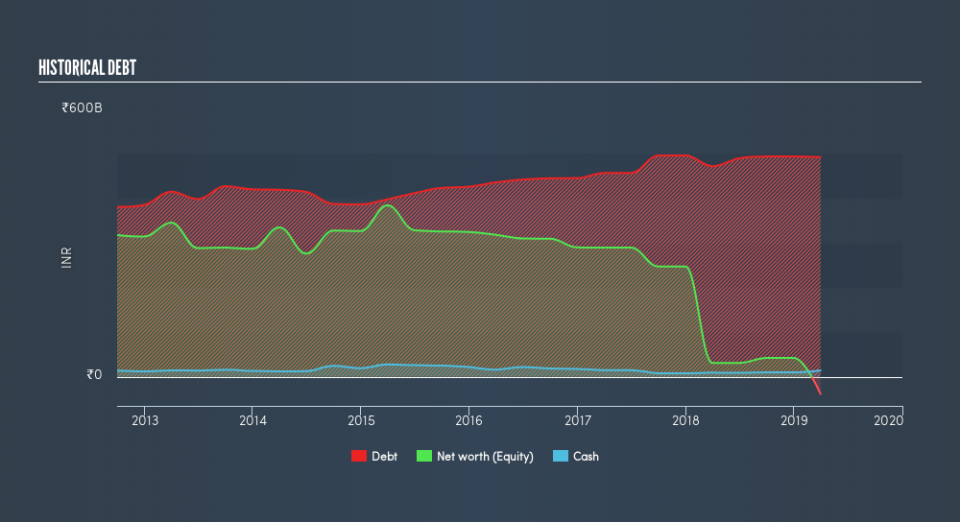
How Much Debt Does Reliance Communications Carry?
As you can see below, at the end of March 2019, Reliance Communications had ₹492.9b of debt, up from ₹472.3b a year ago. Click the image for more detail. However, it does have ₹14.4b in cash offsetting this, leading to net debt of about ₹478.5b.
A Look At Reliance Communications's Liabilities
Zooming in on the latest balance sheet data, we can see that Reliance Communications had liabilities of ₹666.6b due within 12 months and liabilities of ₹47.6b due beyond that. Offsetting this, it had ₹14.4b in cash and ₹13.5b in receivables that were due within 12 months. So its liabilities total ₹686.3b more than the combination of its cash and short-term receivables.
The deficiency here weighs heavily on the ₹4.39b company itself, as if a child were struggling under the weight of an enormous back-pack full of books, his sports gear, and a trumpet. So we'd watch its balance sheet closely, without a doubt After all, Reliance Communications would likely require a major re-capitalisation if it had to pay its creditors today. The balance sheet is clearly the area to focus on when you are analysing debt. But you can't view debt in total isolation; since Reliance Communications will need earnings to service that debt. So when considering debt, it's definitely worth looking at the earnings trend. Click here for an interactive snapshot.
Over 12 months, Reliance Communications saw its revenue drop to ₹42b, which is a fall of 10%. That's not what we would hope to see.
Caveat Emptor
While Reliance Communications's falling revenue is about as heartwarming as a wet blanket, arguably its earnings before interest and tax (EBIT) loss is even less appealing. Indeed, it lost a very considerable ₹2.6b at the EBIT level. Reflecting on this and the significant total liabilities, it's hard to know what to say about the stock because of our intense dis-affinity for it. Sure, the company might have a nice story about how they are going on to a brighter future. But the reality is that it is low on liquid assets relative to liabilities, and it lost ₹8.6b in the last year. So we're about as excited about owning this stock as hiking up a snowy mountain with wet socks on in the rain. It's too risky for us. When we look at a riskier company, we like to check how their profits (or losses) are trending over time. Today, we're providing readers this interactive graph showing how Reliance Communications's profit, revenue, and operating cashflow have changed over the last few years.
If you're interested in investing in businesses that can grow profits without the burden of debt, then check out this free list of growing businesses that have net cash on the balance sheet.
We aim to bring you long-term focused research analysis driven by fundamental data. Note that our analysis may not factor in the latest price-sensitive company announcements or qualitative material.
If you spot an error that warrants correction, please contact the editor at editorial-team@simplywallst.com. This article by Simply Wall St is general in nature. It does not constitute a recommendation to buy or sell any stock, and does not take account of your objectives, or your financial situation. Simply Wall St has no position in the stocks mentioned. Thank you for reading.
