Renewable Energy Group, Inc. (NASDAQ:REGI) Earns A Nice Return On Capital Employed

Today we are going to look at Renewable Energy Group, Inc. (NASDAQ:REGI) to see whether it might be an attractive investment prospect. In particular, we'll consider its Return On Capital Employed (ROCE), as that can give us insight into how profitably the company is able to employ capital in its business.
First, we'll go over how we calculate ROCE. Next, we'll compare it to others in its industry. Then we'll determine how its current liabilities are affecting its ROCE.
Return On Capital Employed (ROCE): What is it?
ROCE is a metric for evaluating how much pre-tax income (in percentage terms) a company earns on the capital invested in its business. Generally speaking a higher ROCE is better. Overall, it is a valuable metric that has its flaws. Author Edwin Whiting says to be careful when comparing the ROCE of different businesses, since 'No two businesses are exactly alike.'
So, How Do We Calculate ROCE?
The formula for calculating the return on capital employed is:
Return on Capital Employed = Earnings Before Interest and Tax (EBIT) ÷ (Total Assets - Current Liabilities)
Or for Renewable Energy Group:
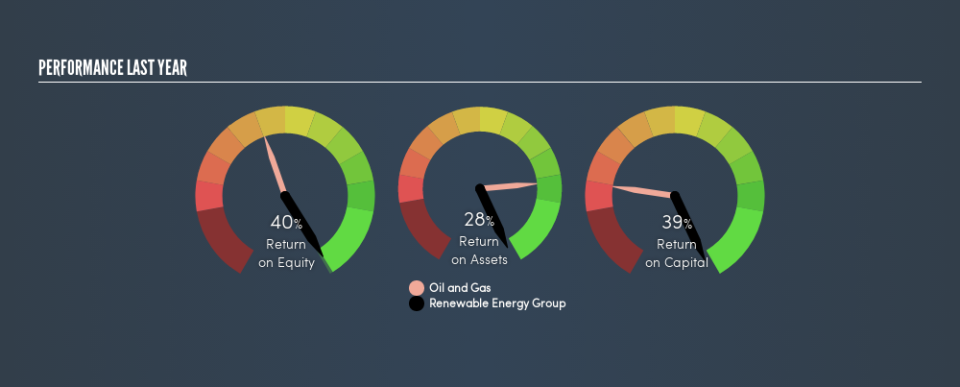
0.39 = US$313m ÷ (US$1.1b - US$295m) (Based on the trailing twelve months to December 2018.)
So, Renewable Energy Group has an ROCE of 39%.
View our latest analysis for Renewable Energy Group
Does Renewable Energy Group Have A Good ROCE?
ROCE can be useful when making comparisons, such as between similar companies. Renewable Energy Group's ROCE appears to be substantially greater than the 9.2% average in the Oil and Gas industry. We would consider this a positive, as it suggests it is using capital more effectively than other similar companies. Setting aside the comparison to its industry for a moment, Renewable Energy Group's ROCE in absolute terms currently looks quite high.
Our data shows that Renewable Energy Group currently has an ROCE of 39%, compared to its ROCE of 2.2% 3 years ago. This makes us wonder if the company is improving.
Remember that this metric is backwards looking - it shows what has happened in the past, and does not accurately predict the future. ROCE can be misleading for companies in cyclical industries, with returns looking impressive during the boom times, but very weak during the busts. This is because ROCE only looks at one year, instead of considering returns across a whole cycle. Remember that most companies like Renewable Energy Group are cyclical businesses. What happens in the future is pretty important for investors, so we have prepared a free report on analyst forecasts for Renewable Energy Group.
Renewable Energy Group's Current Liabilities And Their Impact On Its ROCE
Current liabilities include invoices, such as supplier payments, short-term debt, or a tax bill, that need to be paid within 12 months. Due to the way the ROCE equation works, having large bills due in the near term can make it look as though a company has less capital employed, and thus a higher ROCE than usual. To check the impact of this, we calculate if a company has high current liabilities relative to its total assets.
Renewable Energy Group has total liabilities of US$295m and total assets of US$1.1b. As a result, its current liabilities are equal to approximately 27% of its total assets. A minimal amount of current liabilities limits the impact on ROCE.
What We Can Learn From Renewable Energy Group's ROCE
With low current liabilities and a high ROCE, Renewable Energy Group could be worthy of further investigation. Renewable Energy Group shapes up well under this analysis, but it is far from the only business delivering excellent numbers . You might also want to check this free collection of companies delivering excellent earnings growth.
If you are like me, then you will not want to miss this free list of growing companies that insiders are buying.
We aim to bring you long-term focused research analysis driven by fundamental data. Note that our analysis may not factor in the latest price-sensitive company announcements or qualitative material.
If you spot an error that warrants correction, please contact the editor at editorial-team@simplywallst.com. This article by Simply Wall St is general in nature. It does not constitute a recommendation to buy or sell any stock, and does not take account of your objectives, or your financial situation. Simply Wall St has no position in the stocks mentioned. Thank you for reading.

