Researchers and volunteers joined together to map extreme heat in OKC. What could it show?
On a recent afternoon, raindrops began splattering across the windshield of a vehicle trekking under 30 mph through northwest Oklahoma City. It was hardly even light rainfall, but the two women in the vehicle knew they had to pull over immediately near the OKC Fairgrounds and cut their drive short.
They couldn't risk any damage to the heat-sensing equipment they'd mounted to the passenger-side window.
Oklahoma City Councilwoman JoBeth Hamon, who was navigating the trip, said the route they'd just driven along already showed signs of problems faced by residents throughout the city this summer.
“People are really feeling the crunch in increased energy costs, and then (with) how hot it is, being able to balance out keeping their home or business well-cooled ... is a lot of what I’ve heard,” Hamon said.
City leaders had been working for months to coordinate a massive, localized effort to collect data for the hottest areas of the city ― data that could be used to shape policies for infrastructure and environmental planning in the near future.
On Saturday, nearly 250 volunteers drove 33 routes through the city on what was originally projected as the hottest day of the year for the metro area, and thus the best day to carry out the campaign.
Even though rain surprised planners, abrupt changes in weather didn't cancel the event and volunteers were able to adapt.
“I’m disappointed that we didn’t have triple-digit heat indexes (Saturday),” said Sarah Terry-Cobo, an associate planner with Oklahoma City's Office of Sustainability. “But I’m confident that we’ve gotten a good representative sample that we can still be able to show the urban heat island effect and how it affects Oklahoma City.”
An urban heat island is the term for areas with fewer trees and more pavement, which allows for increased heat absorption. These locations can be up to 20 degrees hotter than neighborhoods with more trees, more grass and less asphalt.
Oklahoma City was selected, along with nearly 20 other communities throughout the U.S., to participate in the 2023 Urban Heat Island Mapping Campaign from the National Oceanic and Atmospheric Administration.
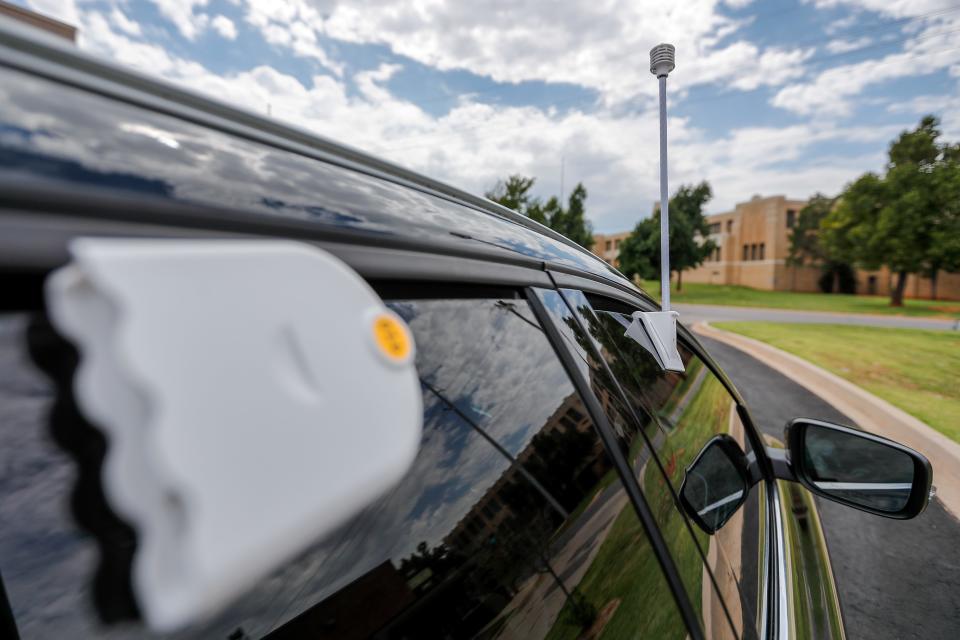
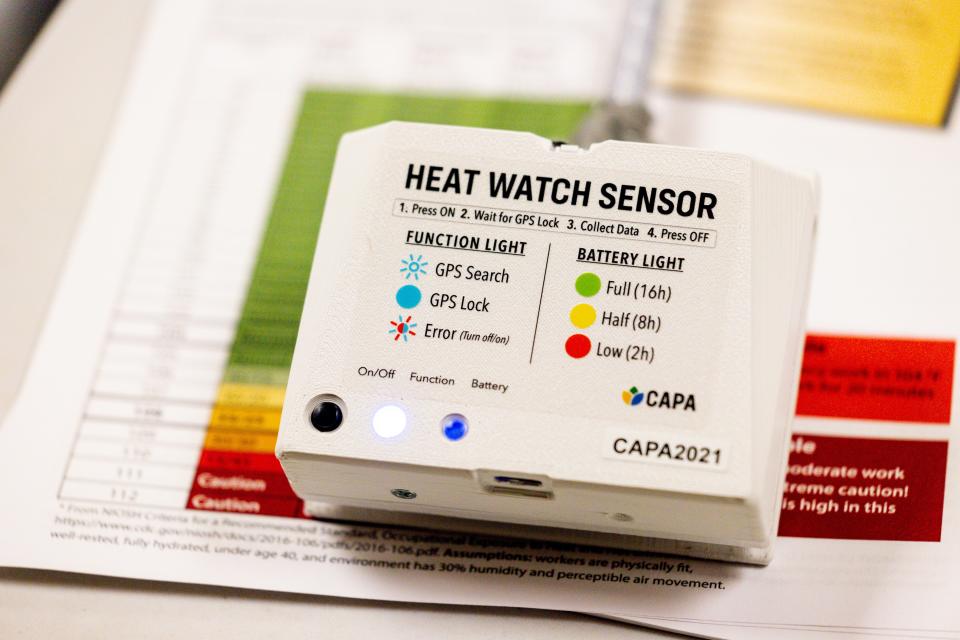
Planners with Oklahoma City’s sustainability office worked to launch the event with volunteer “citizen scientists” who traveled along dozens of designated routes throughout the city. Drivers traveled the routes in the morning, afternoon and evening on Saturday, Aug. 12, with heat sensors and air quality monitors mounted to the exterior of their vehicles' windows.
That equipment recorded temperatures, timestamps, and locations, as well as humidity and air quality. Sustainability planners said air particulate pollutants and humidity were measured because of the major role they play in worsening extreme heat.
The data collected will serve as the basis for a report by CAPA Strategies, a NOAA contractor, who will present the information to local decision-makers and organizations on how best to reduce the impacts of extreme heat.

More: Urban heat islands are why it can feel 20 degrees hotter in different parts of the same city
City officials say heat mapping data could inform policy

Hamon, who represents Ward 6 on the city council, volunteered to help Saturday because she wanted to get a firsthand understanding of what areas the routes included and what the process entailed.
“People have postured that areas that are more vulnerable (with) lower economic status have these sort of heat islands,” Hamon said. “It seems like we’re not that different from other places.”
When she and her fellow city councilmembers approved grants to fund the heat mapping event earlier this year, Hamon said she was interested in learning how the heat island effect might be worsening complaints coming from residents in her ward.
She also said she was curious to see what benefits Saturday’s data might show in terms of supporting other types of low-impact development, such as rain gardens and stormwater drainage.
“That helps with heat absorption and deflection if you have just less concrete everywhere,” Hamon said. “For me, my perspective from the city is figuring out how we help invest in both helping people do those things but also building it into our own city processes.”
Related: We created scorching 'heat islands' in major U.S. cities. Now they're becoming unlivable
Researchers say residents already feel far-reaching effects of heat islands
The project also included several city agencies, various local organizations and nonprofits, and multiple colleges. Researchers at the University of Oklahoma, including its colleges of architecture, geography and public health, were enthusiastic about partnering with sustainability planners for the campaign.
Wenwen Cheng, an assistant professor at OU's Gibbs College of Architecture, already had been undertaking NASA-funded research into how heat vulnerabilities were affecting low-income neighborhoods in Oklahoma City. She told The Oklahoman she was eager to support the city's sustainability office in its attempt to pinpoint urban heat islands.
Cheng and fellow researchers have generated a Heat Vulnerability Index, which determines a population's sensitivity to heat susceptibility, their capability of lessening or adapting to heat, and their level of exposure to adverse heat-worsening conditions. During her research on the John F. Kennedy neighborhood in northeast Oklahoma City, Cheng said residents frequently expressed concern about sidewalks having no trees.
“I remember one map was basically all circles of sidewalks and pathways, ” Cheng said. “Circle, circle, circle, circle, circle… And on the map, residents would mark, ‘No trees, more sidewalk.’ ‘Needs more trees,’ so that is definitely one thing. You ask them to walk outside to promote physical activity and prevent chronic disease because walking is really important to general physical health. But people have no place to go do that.”
What can the data do for the OKC's vulnerable populations?
Cities throughout the nation have used information from past heat mapping campaigns to develop their own plans for climate adaptive infrastructure, and Cheng, Hamon and Terry-Cobo are all hopeful the same will happen for Oklahoma City.
“We’re just really excited about the possibilities for what this data will show,” Terry-Cobo said. “I can’t overstate how important this research is and what this is going to do for policymakers to be able to get this info into their hands so they can really prioritize solutions for those who are affected the most.”
Both short-term and long-term results could look like increased tree-planting strategies, more public transit shelters, new cooling relief centers, updates in weatherization for buildings, and revisions to zoning law and code regulations.
More: Severe heat is worsening. OKC planners needed volunteers to help measure the impact.
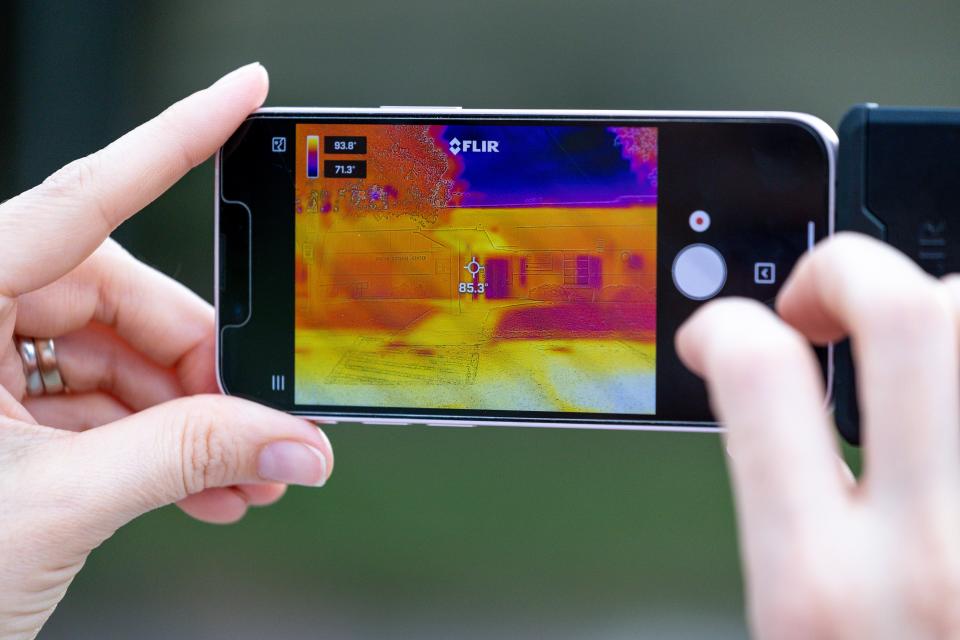
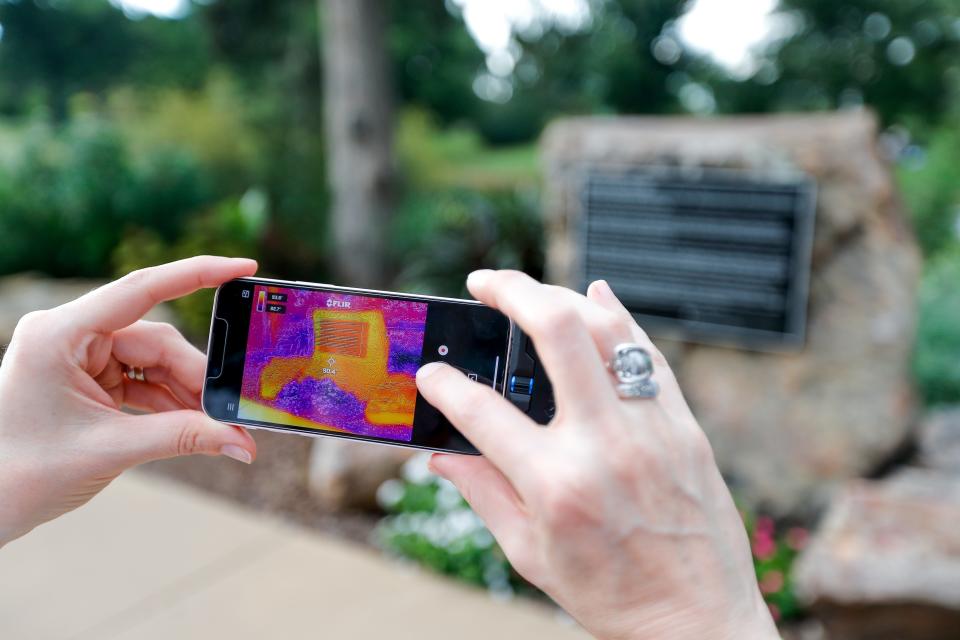
Whichever decision-makers choose, Terry-Cobo said the decisions can't come soon enough. While talking with The Oklahoman on Saturday outside the Will Rogers Senior Center, she pointed a thermal imaging camera toward a nearby prairie garden and then at the brick-heavy entryway pillar beside it. The shrubbery was just under 76 degrees, while the brick read 83 degrees.
“That just says everything to me,” Terry-Cobo said. “Having so many parking lots is a problem, but the other thing is everything that we build our cities with, how we build our cities. Extreme heat is only going to get worse, and we have to start building our cities in ways that can adapt to what’s coming.”
This article originally appeared on Oklahoman: How heat mapping efforts could help OKC's most vulnerable

