With A Return On Equity Of 11%, Has Interfor Corporation’s (TSE:IFP) Management Done Well?

While some investors are already well versed in financial metrics (hat tip), this article is for those who would like to learn about Return On Equity (ROE) and why it is important. We’ll use ROE to examine Interfor Corporation (TSE:IFP), by way of a worked example.
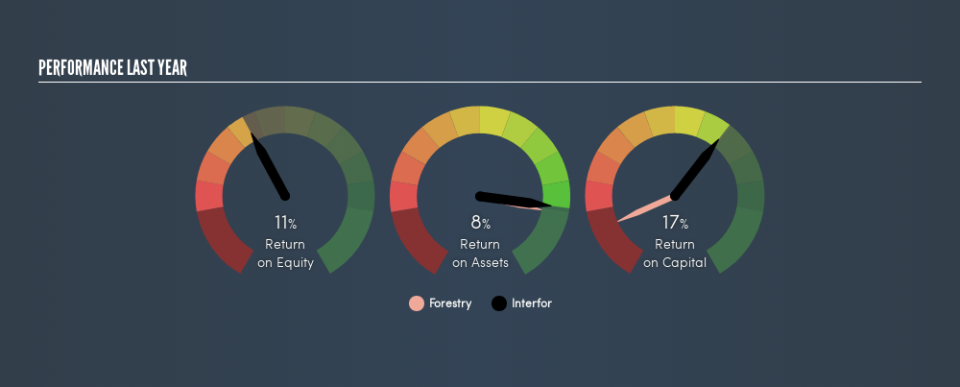
Over the last twelve months Interfor has recorded a ROE of 11%. One way to conceptualize this, is that for each CA$1 of shareholders’ equity it has, the company made CA$0.11 in profit.
See our latest analysis for Interfor
Want to participate in a research study? Help shape the future of investing tools and earn a $60 gift card!
How Do You Calculate ROE?
The formula for return on equity is:
Return on Equity = Net Profit ÷ Shareholders’ Equity
Or for Interfor:
11% = CA$112m ÷ CA$974m (Based on the trailing twelve months to December 2018.)
Most readers would understand what net profit is, but it’s worth explaining the concept of shareholders’ equity. It is all earnings retained by the company, plus any capital paid in by shareholders. The easiest way to calculate shareholders’ equity is to subtract the company’s total liabilities from the total assets.
What Does Return On Equity Signify?
ROE measures a company’s profitability against the profit it retains, and any outside investments. The ‘return’ is the amount earned after tax over the last twelve months. That means that the higher the ROE, the more profitable the company is. So, all else equal, investors should like a high ROE. Clearly, then, one can use ROE to compare different companies.
Does Interfor Have A Good ROE?
Arguably the easiest way to assess company’s ROE is to compare it with the average in its industry. The limitation of this approach is that some companies are quite different from others, even within the same industry classification. You can see in the graphic below that Interfor has an ROE that is fairly close to the average for the Forestry industry (12%).
That’s not overly surprising. ROE doesn’t tell us if the share price is low, but it can inform us to the nature of the business. For those looking for a bargain, other factors may be more important. If you are like me, then you will not want to miss this free list of growing companies that insiders are buying.
The Importance Of Debt To Return On Equity
Companies usually need to invest money to grow their profits. That cash can come from retained earnings, issuing new shares (equity), or debt. In the first and second cases, the ROE will reflect this use of cash for investment in the business. In the latter case, the use of debt will improve the returns, but will not change the equity. That will make the ROE look better than if no debt was used.
Combining Interfor’s Debt And Its 11% Return On Equity
While Interfor does have some debt, with debt to equity of just 0.28, we wouldn’t say debt is excessive. Its very respectable ROE, combined with only modest debt, suggests the business is in good shape. Conservative use of debt to boost returns is usually a good move for shareholders, though it does leave the company more exposed to interest rate rises.
The Bottom Line On ROE
Return on equity is useful for comparing the quality of different businesses. A company that can achieve a high return on equity without debt could be considered a high quality business. If two companies have around the same level of debt to equity, and one has a higher ROE, I’d generally prefer the one with higher ROE.
But ROE is just one piece of a bigger puzzle, since high quality businesses often trade on high multiples of earnings. The rate at which profits are likely to grow, relative to the expectations of profit growth reflected in the current price, must be considered, too. So you might want to take a peek at this data-rich interactive graph of forecasts for the company.
Of course, you might find a fantastic investment by looking elsewhere. So take a peek at this free list of interesting companies.
We aim to bring you long-term focused research analysis driven by fundamental data. Note that our analysis may not factor in the latest price-sensitive company announcements or qualitative material.
If you spot an error that warrants correction, please contact the editor at editorial-team@simplywallst.com. This article by Simply Wall St is general in nature. It does not constitute a recommendation to buy or sell any stock, and does not take account of your objectives, or your financial situation. Simply Wall St has no position in the stocks mentioned. Thank you for reading.

