With A Return On Equity Of 8.0%, Has RENHENG Enterprise Holdings Limited's (HKG:3628) Management Done Well?

Want to participate in a short research study? Help shape the future of investing tools and you could win a $250 gift card!
While some investors are already well versed in financial metrics (hat tip), this article is for those who would like to learn about Return On Equity (ROE) and why it is important. We'll use ROE to examine RENHENG Enterprise Holdings Limited (HKG:3628), by way of a worked example.
Our data shows RENHENG Enterprise Holdings has a return on equity of 8.0% for the last year. That means that for every HK$1 worth of shareholders' equity, it generated HK$0.080 in profit.
See our latest analysis for RENHENG Enterprise Holdings
How Do I Calculate ROE?
The formula for ROE is:
Return on Equity = Net Profit ÷ Shareholders' Equity
Or for RENHENG Enterprise Holdings:
8.0% = HK$9.2m ÷ HK$115m (Based on the trailing twelve months to December 2018.)
It's easy to understand the 'net profit' part of that equation, but 'shareholders' equity' requires further explanation. It is the capital paid in by shareholders, plus any retained earnings. Shareholders' equity can be calculated by subtracting the total liabilities of the company from the total assets of the company.
What Does ROE Signify?
ROE looks at the amount a company earns relative to the money it has kept within the business. The 'return' is the yearly profit. A higher profit will lead to a higher ROE. So, all else equal, investors should like a high ROE. Clearly, then, one can use ROE to compare different companies.
Does RENHENG Enterprise Holdings Have A Good ROE?
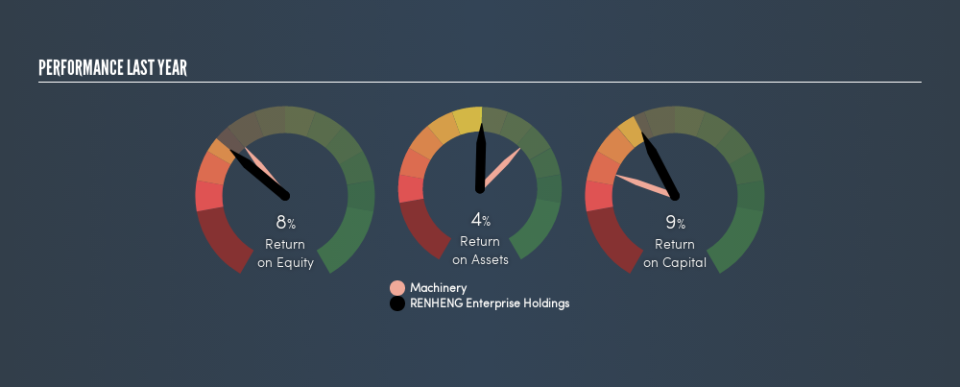
Arguably the easiest way to assess company's ROE is to compare it with the average in its industry. However, this method is only useful as a rough check, because companies do differ quite a bit within the same industry classification. As shown in the graphic below, RENHENG Enterprise Holdings has a lower ROE than the average (10%) in the Machinery industry classification.
That's not what we like to see. It is better when the ROE is above industry average, but a low one doesn't necessarily mean the business is overpriced. Still, shareholders might want to check if insiders have been selling.
How Does Debt Impact ROE?
Most companies need money -- from somewhere -- to grow their profits. That cash can come from issuing shares, retained earnings, or debt. In the first two cases, the ROE will capture this use of capital to grow. In the latter case, the debt required for growth will boost returns, but will not impact the shareholders' equity. That will make the ROE look better than if no debt was used.
RENHENG Enterprise Holdings's Debt And Its 8.0% ROE
Although RENHENG Enterprise Holdings does use a little debt, its debt to equity ratio of just 0.036 is very low. Although the ROE isn't overly impressive, the debt load is modest, suggesting the business has potential. Judicious use of debt to improve returns can certainly be a good thing, although it does elevate risk slightly and reduce future optionality.
The Bottom Line On ROE
Return on equity is a useful indicator of the ability of a business to generate profits and return them to shareholders. A company that can achieve a high return on equity without debt could be considered a high quality business. If two companies have the same ROE, then I would generally prefer the one with less debt.
But ROE is just one piece of a bigger puzzle, since high quality businesses often trade on high multiples of earnings. It is important to consider other factors, such as future profit growth -- and how much investment is required going forward. You can see how the company has grow in the past by looking at this FREE detailed graph of past earnings, revenue and cash flow.
But note: RENHENG Enterprise Holdings may not be the best stock to buy. So take a peek at this free list of interesting companies with high ROE and low debt.
We aim to bring you long-term focused research analysis driven by fundamental data. Note that our analysis may not factor in the latest price-sensitive company announcements or qualitative material.
If you spot an error that warrants correction, please contact the editor at editorial-team@simplywallst.com. This article by Simply Wall St is general in nature. It does not constitute a recommendation to buy or sell any stock, and does not take account of your objectives, or your financial situation. Simply Wall St has no position in the stocks mentioned. Thank you for reading.
