Do Revenio Group Oyj’s (HEL:REG1V) Returns On Capital Employed Make The Cut?

Today we are going to look at Revenio Group Oyj (HEL:REG1V) to see whether it might be an attractive investment prospect. Specifically, we'll consider its Return On Capital Employed (ROCE), since that will give us an insight into how efficiently the business can generate profits from the capital it requires.
First, we'll go over how we calculate ROCE. Next, we'll compare it to others in its industry. Then we'll determine how its current liabilities are affecting its ROCE.
Understanding Return On Capital Employed (ROCE)
ROCE measures the 'return' (pre-tax profit) a company generates from capital employed in its business. In general, businesses with a higher ROCE are usually better quality. Ultimately, it is a useful but imperfect metric. Renowned investment researcher Michael Mauboussin has suggested that a high ROCE can indicate that 'one dollar invested in the company generates value of more than one dollar'.
How Do You Calculate Return On Capital Employed?
The formula for calculating the return on capital employed is:
Return on Capital Employed = Earnings Before Interest and Tax (EBIT) ÷ (Total Assets - Current Liabilities)
Or for Revenio Group Oyj:
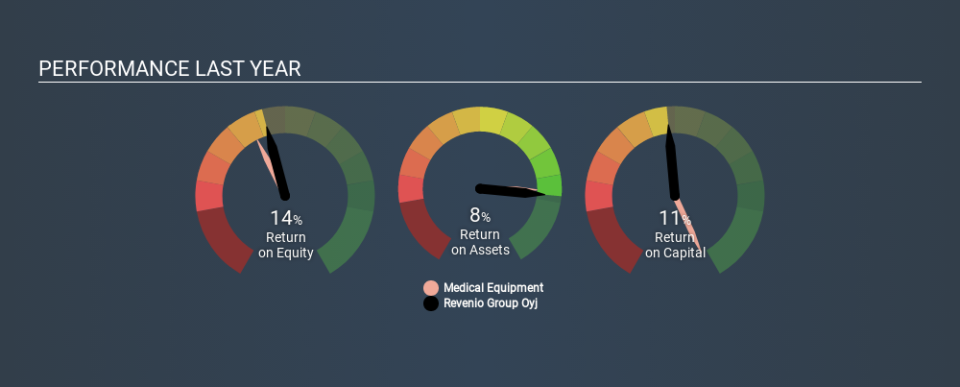
0.11 = €10m ÷ (€105m - €15m) (Based on the trailing twelve months to September 2019.)
Therefore, Revenio Group Oyj has an ROCE of 11%.
View our latest analysis for Revenio Group Oyj
Does Revenio Group Oyj Have A Good ROCE?
One way to assess ROCE is to compare similar companies. It appears that Revenio Group Oyj's ROCE is fairly close to the Medical Equipment industry average of 12%. Independently of how Revenio Group Oyj compares to its industry, its ROCE in absolute terms appears decent, and the company may be worthy of closer investigation.
We can see that, Revenio Group Oyj currently has an ROCE of 11%, less than the 43% it reported 3 years ago. This makes us wonder if the business is facing new challenges. You can see in the image below how Revenio Group Oyj's ROCE compares to its industry. Click to see more on past growth.
It is important to remember that ROCE shows past performance, and is not necessarily predictive. ROCE can be misleading for companies in cyclical industries, with returns looking impressive during the boom times, but very weak during the busts. This is because ROCE only looks at one year, instead of considering returns across a whole cycle. Since the future is so important for investors, you should check out our free report on analyst forecasts for Revenio Group Oyj.
Do Revenio Group Oyj's Current Liabilities Skew Its ROCE?
Liabilities, such as supplier bills and bank overdrafts, are referred to as current liabilities if they need to be paid within 12 months. Due to the way ROCE is calculated, a high level of current liabilities makes a company look as though it has less capital employed, and thus can (sometimes unfairly) boost the ROCE. To check the impact of this, we calculate if a company has high current liabilities relative to its total assets.
Revenio Group Oyj has total assets of €105m and current liabilities of €15m. Therefore its current liabilities are equivalent to approximately 14% of its total assets. A fairly low level of current liabilities is not influencing the ROCE too much.
Our Take On Revenio Group Oyj's ROCE
With that in mind, Revenio Group Oyj's ROCE appears pretty good. Revenio Group Oyj looks strong on this analysis, but there are plenty of other companies that could be a good opportunity . Here is a free list of companies growing earnings rapidly.
If you like to buy stocks alongside management, then you might just love this free list of companies. (Hint: insiders have been buying them).
If you spot an error that warrants correction, please contact the editor at editorial-team@simplywallst.com. This article by Simply Wall St is general in nature. It does not constitute a recommendation to buy or sell any stock, and does not take account of your objectives, or your financial situation. Simply Wall St has no position in the stocks mentioned.
We aim to bring you long-term focused research analysis driven by fundamental data. Note that our analysis may not factor in the latest price-sensitive company announcements or qualitative material. Thank you for reading.
