Are Rexnord Corporation's (NYSE:RXN) Interest Costs Too High?

Want to participate in a short research study? Help shape the future of investing tools and you could win a $250 gift card!
Small and large cap stocks are widely popular for a variety of reasons, however, mid-cap companies such as Rexnord Corporation (NYSE:RXN), with a market cap of US$3.0b, often get neglected by retail investors. However, generally ignored mid-caps have historically delivered better risk-adjusted returns than the two other categories of stocks. Let’s take a look at RXN’s debt concentration and assess their financial liquidity to get an idea of their ability to fund strategic acquisitions and grow through cyclical pressures. Note that this commentary is very high-level and solely focused on financial health, so I suggest you dig deeper yourself into RXN here.
View our latest analysis for Rexnord
Does RXN Produce Much Cash Relative To Its Debt?
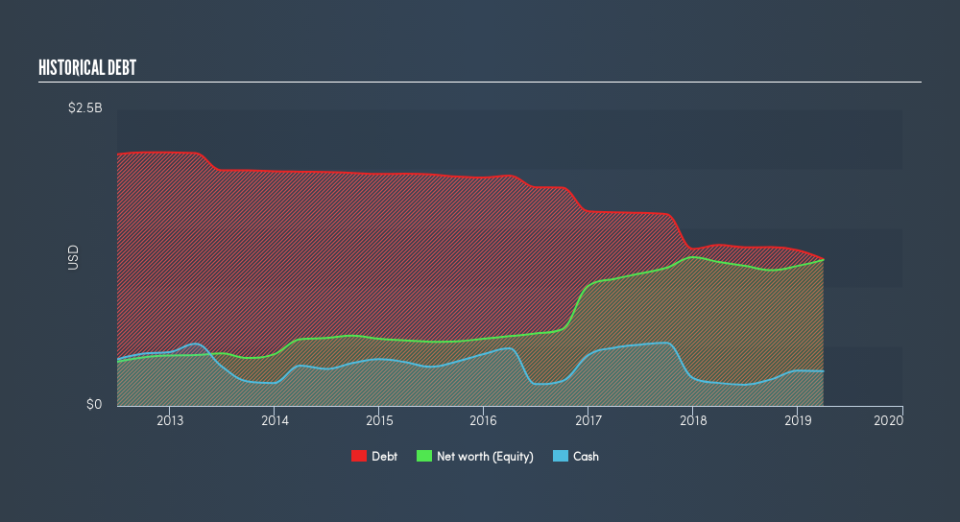
RXN has shrunk its total debt levels in the last twelve months, from US$1.4b to US$1.2b , which also accounts for long term debt. With this debt repayment, the current cash and short-term investment levels stands at US$293m , ready to be used for running the business. Moreover, RXN has produced cash from operations of US$258m in the last twelve months, resulting in an operating cash to total debt ratio of 21%, meaning that RXN’s debt is appropriately covered by operating cash.
Can RXN meet its short-term obligations with the cash in hand?
Looking at RXN’s US$397m in current liabilities, it seems that the business has been able to meet these commitments with a current assets level of US$983m, leading to a 2.48x current account ratio. The current ratio is calculated by dividing current assets by current liabilities. Usually, for Machinery companies, this is a suitable ratio as there's enough of a cash buffer without holding too much capital in low return investments.
Does RXN face the risk of succumbing to its debt-load?
RXN is a highly-leveraged company with debt exceeding equity by over 100%. This is not unusual for mid-caps as debt tends to be a cheaper and faster source of funding for some businesses. We can test if RXN’s debt levels are sustainable by measuring interest payments against earnings of a company. Ideally, earnings before interest and tax (EBIT) should cover net interest by at least three times. For RXN, the ratio of 4.63x suggests that interest is appropriately covered, which means that debtors may be willing to loan the company more money, giving RXN ample headroom to grow its debt facilities.
Next Steps:
RXN’s high cash coverage means that, although its debt levels are high, the company is able to utilise its borrowings efficiently in order to generate cash flow. Since there is also no concerns around RXN's liquidity needs, this may be its optimal capital structure for the time being. Keep in mind I haven't considered other factors such as how RXN has been performing in the past. You should continue to research Rexnord to get a better picture of the mid-cap by looking at:
Future Outlook: What are well-informed industry analysts predicting for RXN’s future growth? Take a look at our free research report of analyst consensus for RXN’s outlook.
Valuation: What is RXN worth today? Is the stock undervalued, even when its growth outlook is factored into its intrinsic value? The intrinsic value infographic in our free research report helps visualize whether RXN is currently mispriced by the market.
Other High-Performing Stocks: Are there other stocks that provide better prospects with proven track records? Explore our free list of these great stocks here.
We aim to bring you long-term focused research analysis driven by fundamental data. Note that our analysis may not factor in the latest price-sensitive company announcements or qualitative material.
If you spot an error that warrants correction, please contact the editor at editorial-team@simplywallst.com. This article by Simply Wall St is general in nature. It does not constitute a recommendation to buy or sell any stock, and does not take account of your objectives, or your financial situation. Simply Wall St has no position in the stocks mentioned. Thank you for reading.
