Rheinmetall AG (ETR:RHM) Is Employing Capital Very Effectively

Today we'll look at Rheinmetall AG (ETR:RHM) and reflect on its potential as an investment. Specifically, we're going to calculate its Return On Capital Employed (ROCE), in the hopes of getting some insight into the business.
First of all, we'll work out how to calculate ROCE. Then we'll compare its ROCE to similar companies. Finally, we'll look at how its current liabilities affect its ROCE.
Understanding Return On Capital Employed (ROCE)
ROCE measures the amount of pre-tax profits a company can generate from the capital employed in its business. In general, businesses with a higher ROCE are usually better quality. Overall, it is a valuable metric that has its flaws. Author Edwin Whiting says to be careful when comparing the ROCE of different businesses, since 'No two businesses are exactly alike.
So, How Do We Calculate ROCE?
Analysts use this formula to calculate return on capital employed:
Return on Capital Employed = Earnings Before Interest and Tax (EBIT) ÷ (Total Assets - Current Liabilities)
Or for Rheinmetall:
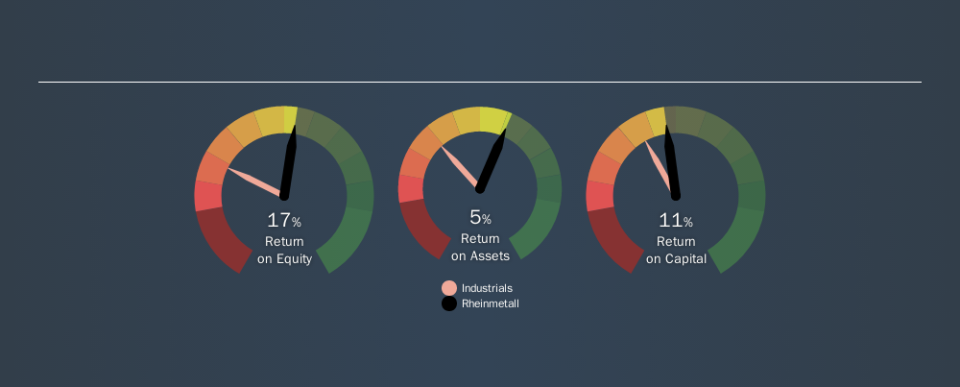
0.11 = €474m ÷ (€7.1b - €2.9b) (Based on the trailing twelve months to September 2019.)
Therefore, Rheinmetall has an ROCE of 11%.
See our latest analysis for Rheinmetall
Does Rheinmetall Have A Good ROCE?
When making comparisons between similar businesses, investors may find ROCE useful. Using our data, we find that Rheinmetall's ROCE is meaningfully better than the 5.9% average in the Industrials industry. We would consider this a positive, as it suggests it is using capital more effectively than other similar companies. Independently of how Rheinmetall compares to its industry, its ROCE in absolute terms appears decent, and the company may be worthy of closer investigation.
Our data shows that Rheinmetall currently has an ROCE of 11%, compared to its ROCE of 8.5% 3 years ago. This makes us wonder if the company is improving. The image below shows how Rheinmetall's ROCE compares to its industry, and you can click it to see more detail on its past growth.
When considering this metric, keep in mind that it is backwards looking, and not necessarily predictive. ROCE can be misleading for companies in cyclical industries, with returns looking impressive during the boom times, but very weak during the busts. This is because ROCE only looks at one year, instead of considering returns across a whole cycle. What happens in the future is pretty important for investors, so we have prepared a free report on analyst forecasts for Rheinmetall.
Rheinmetall's Current Liabilities And Their Impact On Its ROCE
Liabilities, such as supplier bills and bank overdrafts, are referred to as current liabilities if they need to be paid within 12 months. Due to the way the ROCE equation works, having large bills due in the near term can make it look as though a company has less capital employed, and thus a higher ROCE than usual. To counteract this, we check if a company has high current liabilities, relative to its total assets.
Rheinmetall has total assets of €7.1b and current liabilities of €2.9b. As a result, its current liabilities are equal to approximately 40% of its total assets. Rheinmetall has a middling amount of current liabilities, increasing its ROCE somewhat.
What We Can Learn From Rheinmetall's ROCE
While its ROCE looks good, it's worth remembering that the current liabilities are making the business look better. There might be better investments than Rheinmetall out there, but you will have to work hard to find them . These promising businesses with rapidly growing earnings might be right up your alley.
I will like Rheinmetall better if I see some big insider buys. While we wait, check out this free list of growing companies with considerable, recent, insider buying.
If you spot an error that warrants correction, please contact the editor at editorial-team@simplywallst.com. This article by Simply Wall St is general in nature. It does not constitute a recommendation to buy or sell any stock, and does not take account of your objectives, or your financial situation. Simply Wall St has no position in the stocks mentioned.
We aim to bring you long-term focused research analysis driven by fundamental data. Note that our analysis may not factor in the latest price-sensitive company announcements or qualitative material. Thank you for reading.

