Is Rheinmetall AG's (FRA:RHM) Liquidity Good Enough?

Want to participate in a short research study? Help shape the future of investing tools and you could win a $250 gift card!
Small-caps and large-caps are wildly popular among investors; however, mid-cap stocks, such as Rheinmetall AG (FRA:RHM) with a market-capitalization of €4.4b, rarely draw their attention. While they are less talked about as an investment category, mid-cap risk-adjusted returns have generally been better than more commonly focused stocks that fall into the small- or large-cap categories. This article will examine RHM’s financial liquidity and debt levels to get an idea of whether the company can deal with cyclical downturns and maintain funds to accommodate strategic spending for future growth. Remember this is a very top-level look that focuses exclusively on financial health, so I recommend a deeper analysis into RHM here.
Check out our latest analysis for Rheinmetall
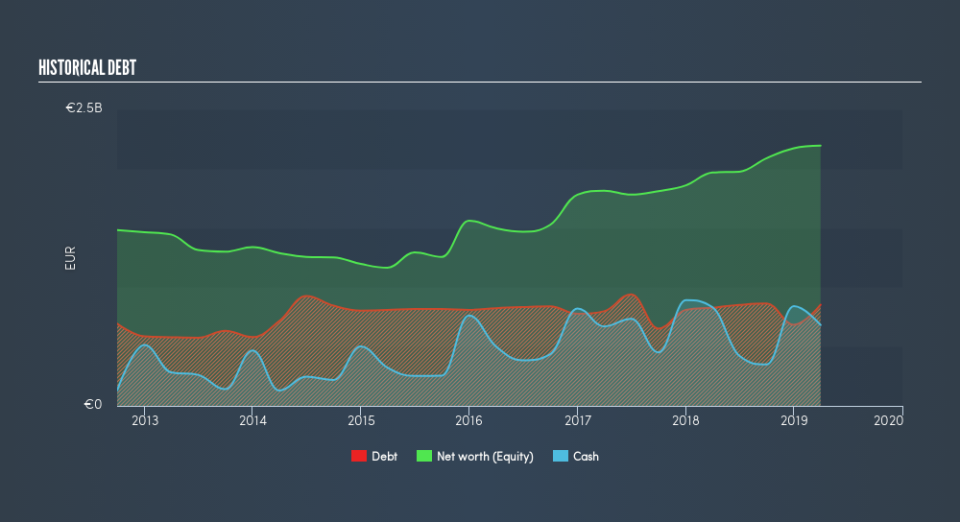
RHM’s Debt (And Cash Flows)
RHM has sustained its debt level by about €853m over the last 12 months which accounts for long term debt. At this stable level of debt, RHM currently has €682m remaining in cash and short-term investments to keep the business going. Additionally, RHM has produced €398m in operating cash flow in the last twelve months, leading to an operating cash to total debt ratio of 47%, meaning that RHM’s operating cash is sufficient to cover its debt.
Does RHM’s liquid assets cover its short-term commitments?
Looking at RHM’s €2.6b in current liabilities, the company has maintained a safe level of current assets to meet its obligations, with the current ratio last standing at 1.48x. The current ratio is the number you get when you divide current assets by current liabilities. Usually, for Industrials companies, this is a suitable ratio since there's a sufficient cash cushion without leaving too much capital idle or in low-earning investments.
Can RHM service its debt comfortably?
With a debt-to-equity ratio of 31%, RHM's debt level may be seen as prudent. This range is considered safe as RHM is not taking on too much debt obligation, which may be constraining for future growth. We can check to see whether RHM is able to meet its debt obligations by looking at the net interest coverage ratio. A company generating earnings before interest and tax (EBIT) at least three times its net interest payments is considered financially sound. In RHM's, case, the ratio of 15.45x suggests that interest is comfortably covered, which means that lenders may be less hesitant to lend out more funding as RHM’s high interest coverage is seen as responsible and safe practice.
Next Steps:
RHM has demonstrated its ability to generate sufficient levels of cash flow, while its debt hovers at an appropriate level. Furthermore, the company exhibits proper management of current assets and upcoming liabilities. Keep in mind I haven't considered other factors such as how RHM has been performing in the past. I suggest you continue to research Rheinmetall to get a better picture of the stock by looking at:
Future Outlook: What are well-informed industry analysts predicting for RHM’s future growth? Take a look at our free research report of analyst consensus for RHM’s outlook.
Valuation: What is RHM worth today? Is the stock undervalued, even when its growth outlook is factored into its intrinsic value? The intrinsic value infographic in our free research report helps visualize whether RHM is currently mispriced by the market.
Other High-Performing Stocks: Are there other stocks that provide better prospects with proven track records? Explore our free list of these great stocks here.
We aim to bring you long-term focused research analysis driven by fundamental data. Note that our analysis may not factor in the latest price-sensitive company announcements or qualitative material.
If you spot an error that warrants correction, please contact the editor at editorial-team@simplywallst.com. This article by Simply Wall St is general in nature. It does not constitute a recommendation to buy or sell any stock, and does not take account of your objectives, or your financial situation. Simply Wall St has no position in the stocks mentioned. Thank you for reading.
