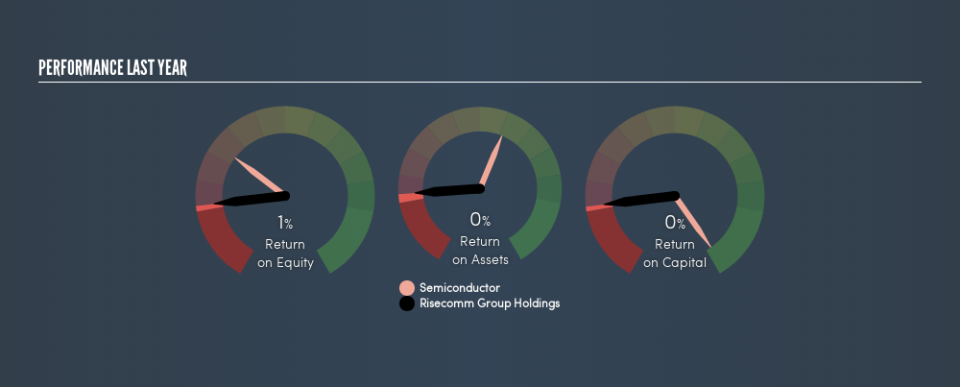
Risecomm Group Holdings Limited’s (HKG:1679) Investment Returns Are Lagging Its Industry

Today we are going to look at Risecomm Group Holdings Limited (HKG:1679) to see whether it might be an attractive investment prospect. Specifically, we’ll consider its Return On Capital Employed (ROCE), since that will give us an insight into how efficiently the business can generate profits from the capital it requires.
First of all, we’ll work out how to calculate ROCE. Then we’ll compare its ROCE to similar companies. Last but not least, we’ll look at what impact its current liabilities have on its ROCE.
Return On Capital Employed (ROCE): What is it?
ROCE is a measure of a company’s yearly pre-tax profit (its return), relative to the capital employed in the business. All else being equal, a better business will have a higher ROCE. In brief, it is a useful tool, but it is not without drawbacks. Author Edwin Whiting says to be careful when comparing the ROCE of different businesses, since ‘No two businesses are exactly alike.’
How Do You Calculate Return On Capital Employed?
Analysts use this formula to calculate return on capital employed:
Return on Capital Employed = Earnings Before Interest and Tax (EBIT) ÷ (Total Assets – Current Liabilities)
Or for Risecomm Group Holdings:
0.0038 = CN¥1.5m ÷ (CN¥562m – CN¥165m) (Based on the trailing twelve months to June 2018.)
So, Risecomm Group Holdings has an ROCE of 0.4%.
Check out our latest analysis for Risecomm Group Holdings
Does Risecomm Group Holdings Have A Good ROCE?
One way to assess ROCE is to compare similar companies. Using our data, Risecomm Group Holdings’s ROCE appears to be significantly below the 6.5% average in the Semiconductor industry. This performance is not ideal, as it suggests the company may not be deploying its capital as effectively as some competitors. Independently of how Risecomm Group Holdings compares to its industry, its ROCE in absolute terms is low; especially compared to the ~2.0% available in government bonds. It is likely that there are more attractive prospects out there.
Risecomm Group Holdings’s current ROCE of 0.4% is lower than 3 years ago, when the company reported a 29% ROCE. So investors might consider if it has had issues recently.
When considering this metric, keep in mind that it is backwards looking, and not necessarily predictive. ROCE can be misleading for companies in cyclical industries, with returns looking impressive during the boom times, but very weak during the busts. ROCE is only a point-in-time measure. If Risecomm Group Holdings is cyclical, it could make sense to check out this free graph of past earnings, revenue and cash flow.
How Risecomm Group Holdings’s Current Liabilities Impact Its ROCE
Short term (or current) liabilities, are things like supplier invoices, overdrafts, or tax bills that need to be paid within 12 months. Due to the way the ROCE equation works, having large bills due in the near term can make it look as though a company has less capital employed, and thus a higher ROCE than usual. To counter this, investors can check if a company has high current liabilities relative to total assets.
Risecomm Group Holdings has total assets of CN¥562m and current liabilities of CN¥165m. As a result, its current liabilities are equal to approximately 29% of its total assets. This is not a high level of current liabilities, which would not boost the ROCE by much.
Our Take On Risecomm Group Holdings’s ROCE
While that is good to see, Risecomm Group Holdings has a low ROCE and does not look attractive in this analysis. You might be able to find a better buy than Risecomm Group Holdings. If you want a selection of possible winners, check out this free list of interesting companies that trade on a P/E below 20 (but have proven they can grow earnings).
For those who like to find winning investments this free list of growing companies with recent insider purchasing, could be just the ticket.
We aim to bring you long-term focused research analysis driven by fundamental data. Note that our analysis may not factor in the latest price-sensitive company announcements or qualitative material.
If you spot an error that warrants correction, please contact the editor at editorial-team@simplywallst.com. This article by Simply Wall St is general in nature. It does not constitute a recommendation to buy or sell any stock, and does not take account of your objectives, or your financial situation. Simply Wall St has no position in the stocks mentioned. Thank you for reading.

