A Rising Share Price Has Us Looking Closely At QAF Limited's (SGX:Q01) P/E Ratio

QAF (SGX:Q01) shares have had a really impressive month, gaining 32%, after some slippage. The bad news is that even after that recovery shareholders are still underwater by about 8.0% for the full year.
Assuming no other changes, a sharply higher share price makes a stock less attractive to potential buyers. While the market sentiment towards a stock is very changeable, in the long run, the share price will tend to move in the same direction as earnings per share. The implication here is that deep value investors might steer clear when expectations of a company are too high. Perhaps the simplest way to get a read on investors' expectations of a business is to look at its Price to Earnings Ratio (PE Ratio). A high P/E ratio means that investors have a high expectation about future growth, while a low P/E ratio means they have low expectations about future growth.
View our latest analysis for QAF
Does QAF Have A Relatively High Or Low P/E For Its Industry?
QAF's P/E of 16.69 indicates some degree of optimism towards the stock. The image below shows that QAF has a higher P/E than the average (10.6) P/E for companies in the food industry.
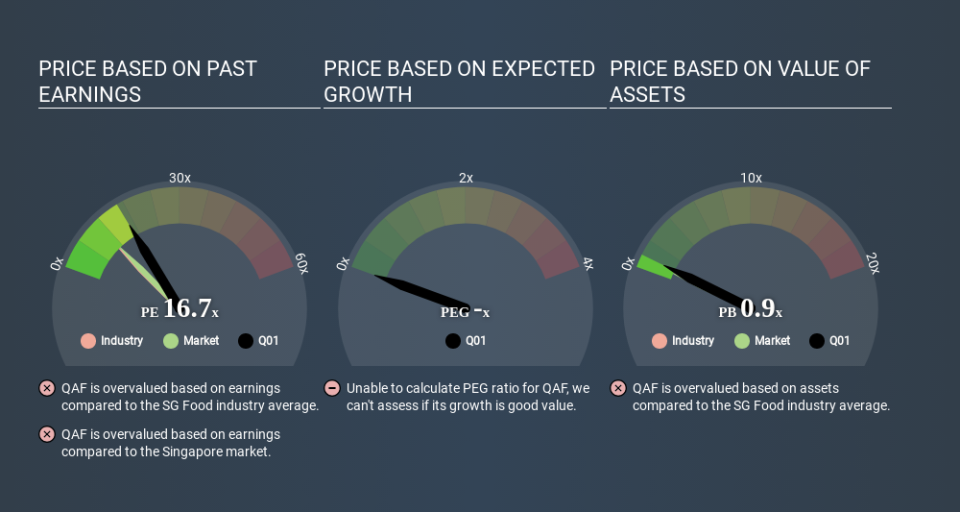
QAF's P/E tells us that market participants think the company will perform better than its industry peers, going forward. Clearly the market expects growth, but it isn't guaranteed. So further research is always essential. I often monitor director buying and selling.
How Growth Rates Impact P/E Ratios
Companies that shrink earnings per share quickly will rapidly decrease the 'E' in the equation. That means unless the share price falls, the P/E will increase in a few years. So while a stock may look cheap based on past earnings, it could be expensive based on future earnings.
QAF's earnings made like a rocket, taking off 237% last year. Unfortunately, earnings per share are down 10% a year, over 5 years.
Remember: P/E Ratios Don't Consider The Balance Sheet
The 'Price' in P/E reflects the market capitalization of the company. That means it doesn't take debt or cash into account. Hypothetically, a company could reduce its future P/E ratio by spending its cash (or taking on debt) to achieve higher earnings.
Such expenditure might be good or bad, in the long term, but the point here is that the balance sheet is not reflected by this ratio.
Is Debt Impacting QAF's P/E?
Net debt totals 11% of QAF's market cap. That's enough debt to impact the P/E ratio a little; so keep it in mind if you're comparing it to companies without debt.
The Verdict On QAF's P/E Ratio
QAF has a P/E of 16.7. That's higher than the average in its market, which is 11.0. The company is not overly constrained by its modest debt levels, and its recent EPS growth is nothing short of stand-out. So on this analysis a high P/E ratio seems reasonable. What is very clear is that the market has become more optimistic about QAF over the last month, with the P/E ratio rising from 12.6 back then to 16.7 today. For those who prefer to invest with the flow of momentum, that might mean it's time to put the stock on a watchlist, or research it. But the contrarian may see it as a missed opportunity.
When the market is wrong about a stock, it gives savvy investors an opportunity. People often underestimate remarkable growth -- so investors can make money when fast growth is not fully appreciated. Although we don't have analyst forecasts you might want to assess this data-rich visualization of earnings, revenue and cash flow.
But note: QAF may not be the best stock to buy. So take a peek at this free list of interesting companies with strong recent earnings growth (and a P/E ratio below 20).
If you spot an error that warrants correction, please contact the editor at editorial-team@simplywallst.com. This article by Simply Wall St is general in nature. It does not constitute a recommendation to buy or sell any stock, and does not take account of your objectives, or your financial situation. Simply Wall St has no position in the stocks mentioned.
We aim to bring you long-term focused research analysis driven by fundamental data. Note that our analysis may not factor in the latest price-sensitive company announcements or qualitative material. Thank you for reading.

