A Rising Share Price Has Us Looking Closely At JBM Auto Limited's (NSE:JBMA) P/E Ratio

JBM Auto (NSE:JBMA) shares have had a really impressive month, gaining 46%, after some slippage. But shareholders may not all be feeling jubilant, since the share price is still down 19% in the last year.
Assuming no other changes, a sharply higher share price makes a stock less attractive to potential buyers. While the market sentiment towards a stock is very changeable, in the long run, the share price will tend to move in the same direction as earnings per share. So some would prefer to hold off buying when there is a lot of optimism towards a stock. One way to gauge market expectations of a stock is to look at its Price to Earnings Ratio (PE Ratio). A high P/E implies that investors have high expectations of what a company can achieve compared to a company with a low P/E ratio.
View our latest analysis for JBM Auto
Does JBM Auto Have A Relatively High Or Low P/E For Its Industry?
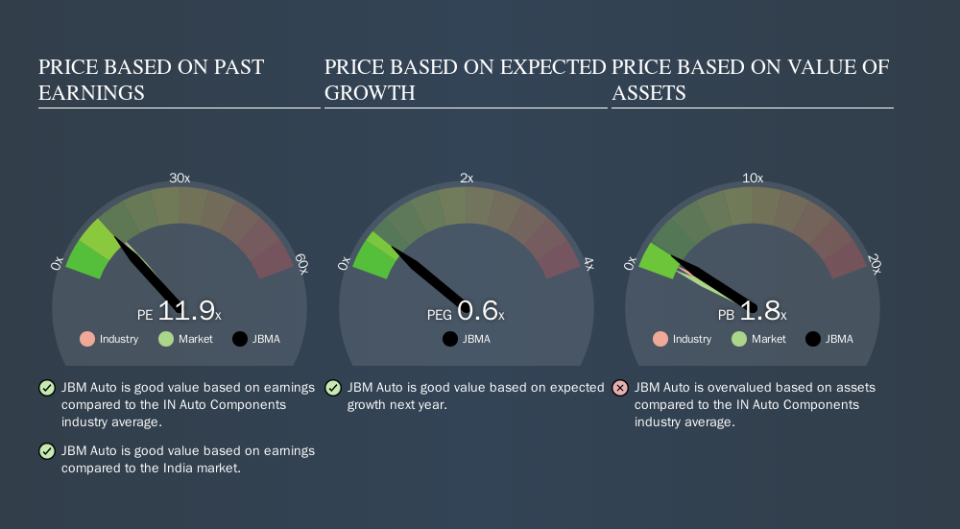
JBM Auto's P/E is 11.92. You can see in the image below that the average P/E (12.8) for companies in the auto components industry is roughly the same as JBM Auto's P/E.
Its P/E ratio suggests that JBM Auto shareholders think that in the future it will perform about the same as other companies in its industry classification. So if JBM Auto actually outperforms its peers going forward, that should be a positive for the share price. I would further inform my view by checking insider buying and selling., among other things.
How Growth Rates Impact P/E Ratios
Probably the most important factor in determining what P/E a company trades on is the earnings growth. Earnings growth means that in the future the 'E' will be higher. And in that case, the P/E ratio itself will drop rather quickly. Then, a lower P/E should attract more buyers, pushing the share price up.
JBM Auto increased earnings per share by 2.9% last year. And it has bolstered its earnings per share by 2.8% per year over the last five years.
Don't Forget: The P/E Does Not Account For Debt or Bank Deposits
The 'Price' in P/E reflects the market capitalization of the company. So it won't reflect the advantage of cash, or disadvantage of debt. Hypothetically, a company could reduce its future P/E ratio by spending its cash (or taking on debt) to achieve higher earnings.
While growth expenditure doesn't always pay off, the point is that it is a good option to have; but one that the P/E ratio ignores.
How Does JBM Auto's Debt Impact Its P/E Ratio?
JBM Auto has net debt worth 80% of its market capitalization. If you want to compare its P/E ratio to other companies, you should absolutely keep in mind it has significant borrowings.
The Verdict On JBM Auto's P/E Ratio
JBM Auto trades on a P/E ratio of 11.9, which is below the IN market average of 13.3. The meaningful debt load is probably contributing to low expectations, even though it has improved earnings recently. What we know for sure is that investors have become more excited about JBM Auto recently, since they have pushed its P/E ratio from 8.1 to 11.9 over the last month. If you like to buy stocks that have recently impressed the market, then this one might be a candidate; but if you prefer to invest when there is 'blood in the streets', then you may feel the opportunity has passed.
Investors should be looking to buy stocks that the market is wrong about. If it is underestimating a company, investors can make money by buying and holding the shares until the market corrects itself. So this free visual report on analyst forecasts could hold the key to an excellent investment decision.
But note: JBM Auto may not be the best stock to buy. So take a peek at this free list of interesting companies with strong recent earnings growth (and a P/E ratio below 20).
We aim to bring you long-term focused research analysis driven by fundamental data. Note that our analysis may not factor in the latest price-sensitive company announcements or qualitative material.
If you spot an error that warrants correction, please contact the editor at editorial-team@simplywallst.com. This article by Simply Wall St is general in nature. It does not constitute a recommendation to buy or sell any stock, and does not take account of your objectives, or your financial situation. Simply Wall St has no position in the stocks mentioned. Thank you for reading.
