A Rising Share Price Has Us Looking Closely At Transtema Group AB's (STO:TRANS) P/E Ratio

Transtema Group (STO:TRANS) shares have had a really impressive month, gaining 32%, after some slippage. But shareholders may not all be feeling jubilant, since the share price is still down 49% in the last year.
All else being equal, a sharp share price increase should make a stock less attractive to potential investors. While the market sentiment towards a stock is very changeable, in the long run, the share price will tend to move in the same direction as earnings per share. So some would prefer to hold off buying when there is a lot of optimism towards a stock. Perhaps the simplest way to get a read on investors' expectations of a business is to look at its Price to Earnings Ratio (PE Ratio). Investors have optimistic expectations of companies with higher P/E ratios, compared to companies with lower P/E ratios.
Check out our latest analysis for Transtema Group
How Does Transtema Group's P/E Ratio Compare To Its Peers?
We can tell from its P/E ratio of 6.34 that sentiment around Transtema Group isn't particularly high. We can see in the image below that the average P/E (26.1) for companies in the telecom industry is higher than Transtema Group's P/E.
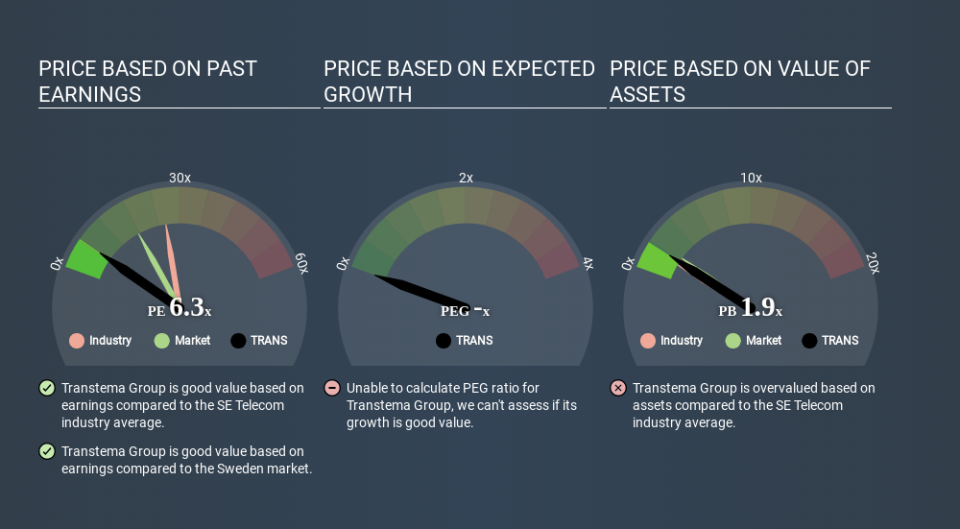
Its relatively low P/E ratio indicates that Transtema Group shareholders think it will struggle to do as well as other companies in its industry classification. While current expectations are low, the stock could be undervalued if the situation is better than the market assumes. You should delve deeper. I like to check if company insiders have been buying or selling.
How Growth Rates Impact P/E Ratios
If earnings fall then in the future the 'E' will be lower. That means even if the current P/E is low, it will increase over time if the share price stays flat. So while a stock may look cheap based on past earnings, it could be expensive based on future earnings.
Transtema Group saw earnings per share decrease by 27% last year. And it has shrunk its earnings per share by 10% per year over the last three years. This growth rate might warrant a low P/E ratio.
Remember: P/E Ratios Don't Consider The Balance Sheet
One drawback of using a P/E ratio is that it considers market capitalization, but not the balance sheet. So it won't reflect the advantage of cash, or disadvantage of debt. In theory, a company can lower its future P/E ratio by using cash or debt to invest in growth.
Such spending might be good or bad, overall, but the key point here is that you need to look at debt to understand the P/E ratio in context.
How Does Transtema Group's Debt Impact Its P/E Ratio?
Transtema Group has net debt equal to 41% of its market cap. While it's worth keeping this in mind, it isn't a worry.
The Bottom Line On Transtema Group's P/E Ratio
Transtema Group trades on a P/E ratio of 6.3, which is below the SE market average of 17.7. The debt levels are not a major concern, but the lack of EPS growth is likely weighing on sentiment. What is very clear is that the market has become less pessimistic about Transtema Group over the last month, with the P/E ratio rising from 4.8 back then to 6.3 today. If you like to buy stocks that could be turnaround opportunities, then this one might be a candidate; but if you're more sensitive to price, then you may feel the opportunity has passed.
Investors should be looking to buy stocks that the market is wrong about. If it is underestimating a company, investors can make money by buying and holding the shares until the market corrects itself. Although we don't have analyst forecasts shareholders might want to examine this detailed historical graph of earnings, revenue and cash flow.
Of course, you might find a fantastic investment by looking at a few good candidates. So take a peek at this free list of companies with modest (or no) debt, trading on a P/E below 20.
Love or hate this article? Concerned about the content? Get in touch with us directly. Alternatively, email editorial-team@simplywallst.com.
This article by Simply Wall St is general in nature. It does not constitute a recommendation to buy or sell any stock, and does not take account of your objectives, or your financial situation. We aim to bring you long-term focused analysis driven by fundamental data. Note that our analysis may not factor in the latest price-sensitive company announcements or qualitative material. Simply Wall St has no position in any stocks mentioned. Thank you for reading.
