A Rising Share Price Has Us Looking Closely At Nexus Infrastructure plc's (LON:NEXS) P/E Ratio

Nexus Infrastructure (LON:NEXS) shares have continued recent momentum with a 32% gain in the last month alone. But shareholders may not all be feeling jubilant, since the share price is still down 13% in the last year.
All else being equal, a sharp share price increase should make a stock less attractive to potential investors. In the long term, share prices tend to follow earnings per share, but in the short term prices bounce around in response to short term factors (which are not always obvious). So some would prefer to hold off buying when there is a lot of optimism towards a stock. Perhaps the simplest way to get a read on investors' expectations of a business is to look at its Price to Earnings Ratio (PE Ratio). A high P/E ratio means that investors have a high expectation about future growth, while a low P/E ratio means they have low expectations about future growth.
See our latest analysis for Nexus Infrastructure
Does Nexus Infrastructure Have A Relatively High Or Low P/E For Its Industry?
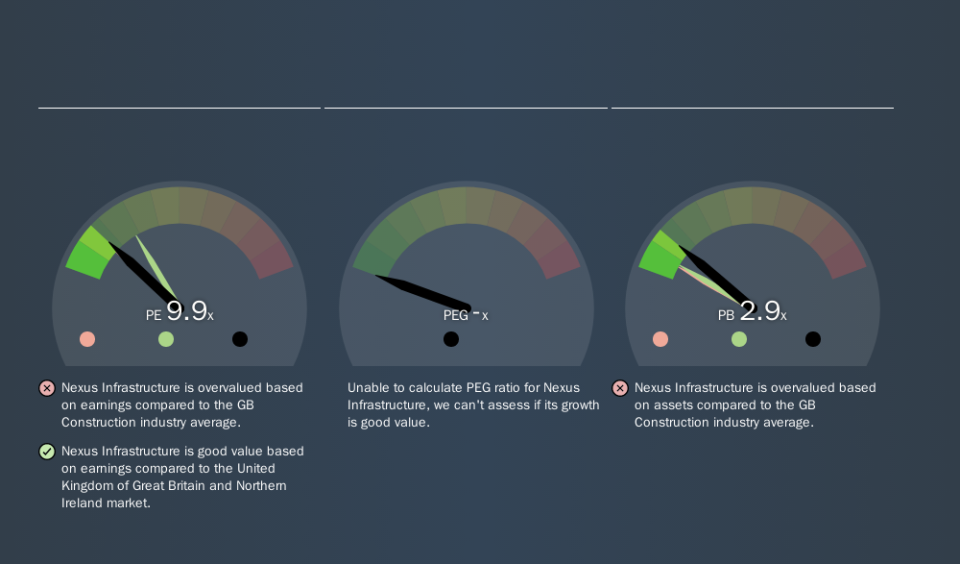
Nexus Infrastructure's P/E is 9.94. As you can see below Nexus Infrastructure has a P/E ratio that is fairly close for the average for the construction industry, which is 9.2.
Nexus Infrastructure's P/E tells us that market participants think its prospects are roughly in line with its industry. If the company has better than average prospects, then the market might be underestimating it. Checking factors such as director buying and selling. could help you form your own view on if that will happen.
How Growth Rates Impact P/E Ratios
If earnings fall then in the future the 'E' will be lower. Therefore, even if you pay a low multiple of earnings now, that multiple will become higher in the future. So while a stock may look cheap based on past earnings, it could be expensive based on future earnings.
Nexus Infrastructure had pretty flat EPS growth in the last year. But EPS is up 4.4% over the last 5 years.
Remember: P/E Ratios Don't Consider The Balance Sheet
The 'Price' in P/E reflects the market capitalization of the company. Thus, the metric does not reflect cash or debt held by the company. Hypothetically, a company could reduce its future P/E ratio by spending its cash (or taking on debt) to achieve higher earnings.
Spending on growth might be good or bad a few years later, but the point is that the P/E ratio does not account for the option (or lack thereof).
Is Debt Impacting Nexus Infrastructure's P/E?
With net cash of UK£13m, Nexus Infrastructure has a very strong balance sheet, which may be important for its business. Having said that, at 21% of its market capitalization the cash hoard would contribute towards a higher P/E ratio.
The Bottom Line On Nexus Infrastructure's P/E Ratio
Nexus Infrastructure trades on a P/E ratio of 9.9, which is below the GB market average of 16.9. EPS was up modestly better over the last twelve months. And the net cash position gives the company many options. So it's strange that the low P/E indicates low expectations. What is very clear is that the market has become less pessimistic about Nexus Infrastructure over the last month, with the P/E ratio rising from 7.5 back then to 9.9 today. If you like to buy stocks that could be turnaround opportunities, then this one might be a candidate; but if you're more sensitive to price, then you may feel the opportunity has passed.
Investors should be looking to buy stocks that the market is wrong about. As value investor Benjamin Graham famously said, 'In the short run, the market is a voting machine but in the long run, it is a weighing machine. So this free visualization of the analyst consensus on future earnings could help you make the right decision about whether to buy, sell, or hold.
Of course you might be able to find a better stock than Nexus Infrastructure. So you may wish to see this free collection of other companies that have grown earnings strongly.
We aim to bring you long-term focused research analysis driven by fundamental data. Note that our analysis may not factor in the latest price-sensitive company announcements or qualitative material.
If you spot an error that warrants correction, please contact the editor at editorial-team@simplywallst.com. This article by Simply Wall St is general in nature. It does not constitute a recommendation to buy or sell any stock, and does not take account of your objectives, or your financial situation. Simply Wall St has no position in the stocks mentioned. Thank you for reading.
